Since late October 2023 both Nvidia Corporation (NVDA) and the S&P 500 (SPX) have traded closely together. Their relationship could provide evidence for a major U.S. stock market top.
The daily NVDA and SPX chart courtesy of Trading View illustrates their relationship.
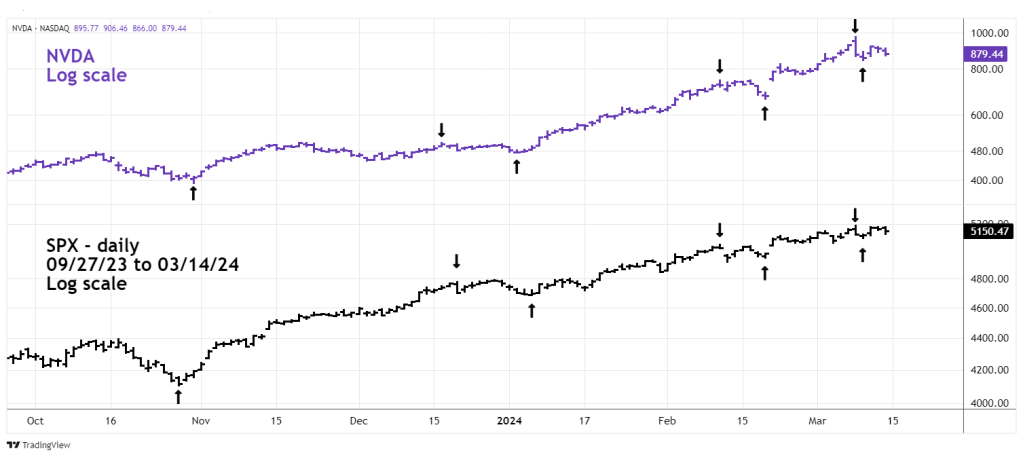
Since late October 2023 NVDA and SPX have made turns within about trading days of each other. Sometimes they’ve turned on the same day. Please note the tops on 03/08/24 and the bottoms on 03/11/24.
The NVDA all-time high was made on 03/08/24 at 973.96. Markets and stocks tend to gravitate to round numbers. There’s a very good chance NVDA could be pushed up to at least 1,000, perhaps even higher.
The 15 – minute NVDA chart shows its recent Elliott wave pattern.
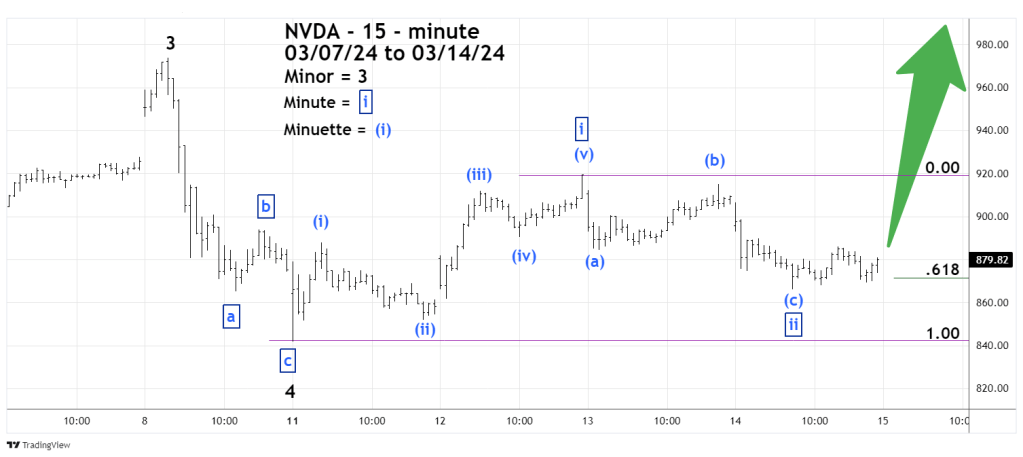
The decline from 03/08/24 to 03/11/24 was a clear Elliott wave Single Zigzag correction. The subsequent rally was a clear Elliott five-wave Impulse pattern. The next decline from 03/12/24 to 03/14/24 was again a clear Single Zigzag, The drop retraced a Fibonacci .618 ratio of the prior rally.
The move up and down from 03/11/24 to 03/14/24 could be the first two waves a larger developing five wave Impulse pattern .
If NVDA rallies above 1,000 completing a five wave Impulse pattern – it could signal an important top for itself and the SPX.
