Alphabet Inc. (GOOGL) has broken below trendline and chart support. This downside move has bearish implications for the stock and perhaps the broader U.S. stock market.
The 02/25/24 blog “Three Magnificent Stocks” examined the technical situation for GOOGL and noted.
“A move below the lower rising trendline and first chart support at 139.49 could open the door for a move back to its October 2023 low”.
The daily GOOGL chart courtesy of Trading View updates its action.
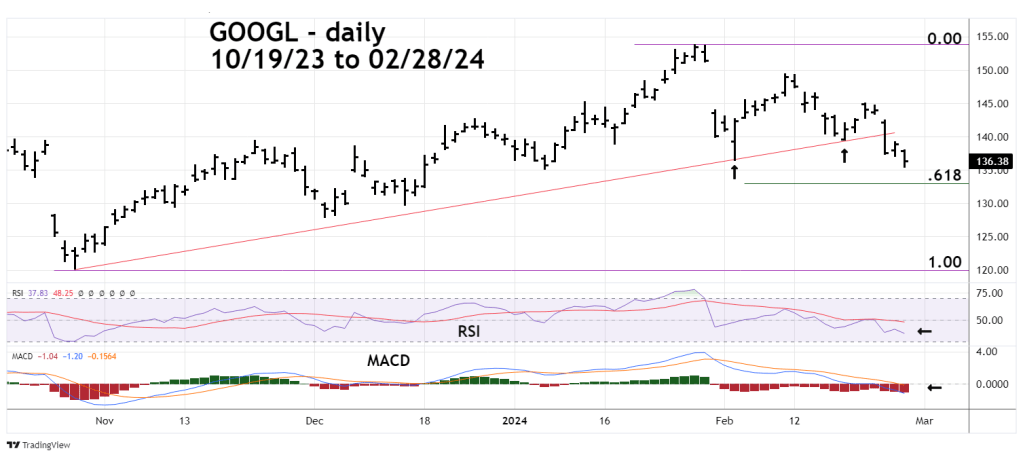
GOOGL has broken below the rising trendline from the October 2023 bottom, first support at 139.49 and second support at 136.50. The stock is nearing Fibonacci support at a .618 retracement of the October to January rally.
Daily RSI has not reached the oversold level which starts at the 30.00 level. MACD lines have just dropped below the zero line. The message from both momentum indicators suggest there could be a move below the Fibonacci .618 support area. If so there’s a good chance GOOGL could soon reach its October 2023 bottom.
As a stock bull market progresses, fewer and fewer stocks participate in the rally.
If GOOGL has begun a bear trend it could seriously weaken the current manic U.S. stock bull market.
