In the late stage of a stock bull market fewer and fewer stocks participate in the rally. This phenomenon can be viewed in the “Magnificent Seven Stocks”. Soon, if one or two of these seven stock breaks to the downside, it could trigger a significant decline in the broader U.S. stock market.
The Magnificent Seven stocks are as follows.
Apple Inc. (AAPL)
Microsoft Corporation (MSFT)
Alphabet Inc. (GOOGL)
Amazon.com Inc. (AMZN)
Nvidia Corporation (NVDA)
Meta Platforms Inc. (META)
Tesla Inc. (TSLA)
The bearish deterioration of this group has already started.
TSLA made its all-time high 27 – months ago and is more than 50% below that peak.
On 02/23/24 – NVDA, META, and AMZN made all-time highs.
The remaining three stocks look like they could be ready to jump on the bear train.
The daily AAPL chart courtesy of Trading View updates its progress.
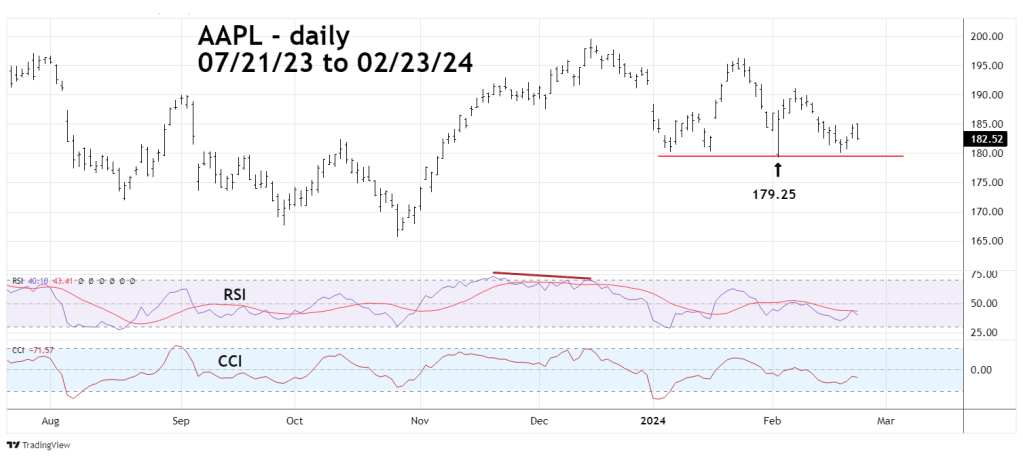
APPL was illustrated in the 02/15/24 blog “Apple Inc. Downside Rollover?” Since then, AAPL has tested support at 179.25 followed by a bounce. On 02/23/24 AAPL closed at its low of the day and could make another run at the 179.25 level. A break below this important support could open the door for a rapid drop to the 165.00 area.
The daily chart of GOOGL illustrates its progress.

In recent weeks GOOGL has formed an “Indecision Triangle”. A move above the upper declining trendline and first chart resistance at 149.44 implies a new all-time high could be made. A move below the lower rising trendline and first chart support at 139.49 could open the door for a move back to its October 2023 low.
Watch GOOGL trendlines.
The daily MSFT chart also has an interesting formation.
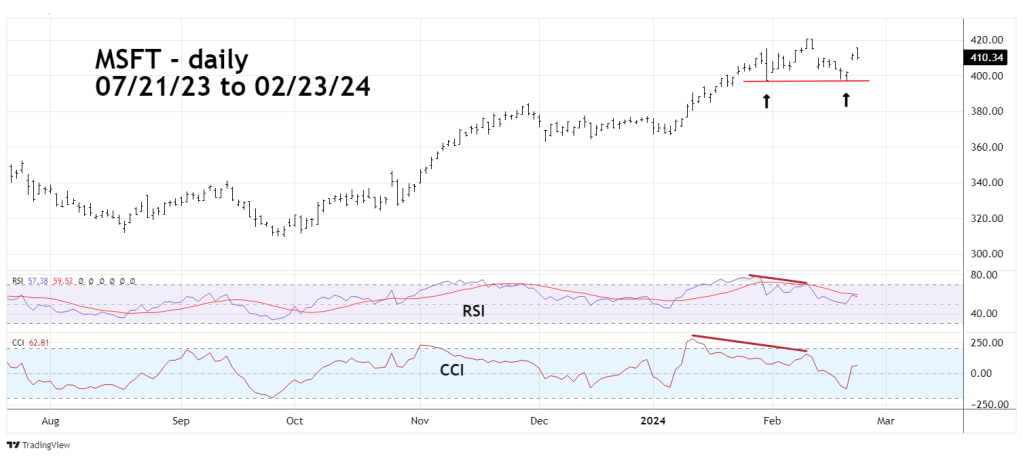
At the MSFT all-time high on 02/09/24 it had bearish RSI and CCI divergences. And as of 02/23/24 MSFT had a “Head and Sholders” pattern.
Just a side note on the Head and Sholders pattern. Some Technical analysts will illustrate a Head and Sholders with one shoulder far above the other shoulder. Correspondingly one bottom will be far above the other. Many times, these types of Head and Sholders patterns fail.
The trick to finding a more reliable Head and Sholders is the closeness of the two bottoms.
In the current MSFT situation, the first bottom is at 397.21 the second made on 02/21/24 was at 397.22. If MSFT can break below 397.21 it could trigger a rapid drop to the 370 area.
The most likely of the three stocks to drop is AAPL. A break below 179.25 could start a broad decline for U.S. stocks.
