On 02/09/24 the S&P 500 (SPX) and Nasdaq Composite made new post October 2022 rally highs. Momentum and sentiment readings were extremely bearish suggesting an approaching decline for U.S. stocks.
The daily NYSE – 52 – week high ($MAHN) chart courtesy of Barchart.com illustrates internal momentum for the U.S. stock market.
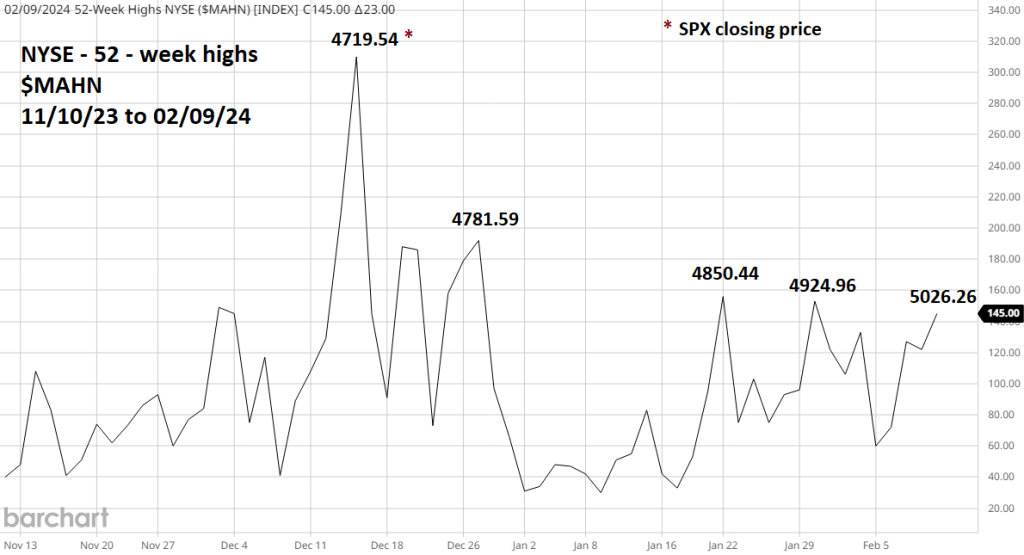
As the stock market rallies, fewer and fewer stocks make new highs. Stocks discount the future, and all companies are not equal. The smaller and or weaker company stocks are the first to falter in anticipation of a weakening economy. When a stock market rally is nearing a climax, the strongest and or largest company stocks are making new highs.
The NYSE post October 2022 rally momentum maximum was in mid- December 2023. Since then, the SPX has made new highs as the number of individual stock highs have declined.
The daily VIX chart courtesy of Trading View illustrates SPX sentiment.
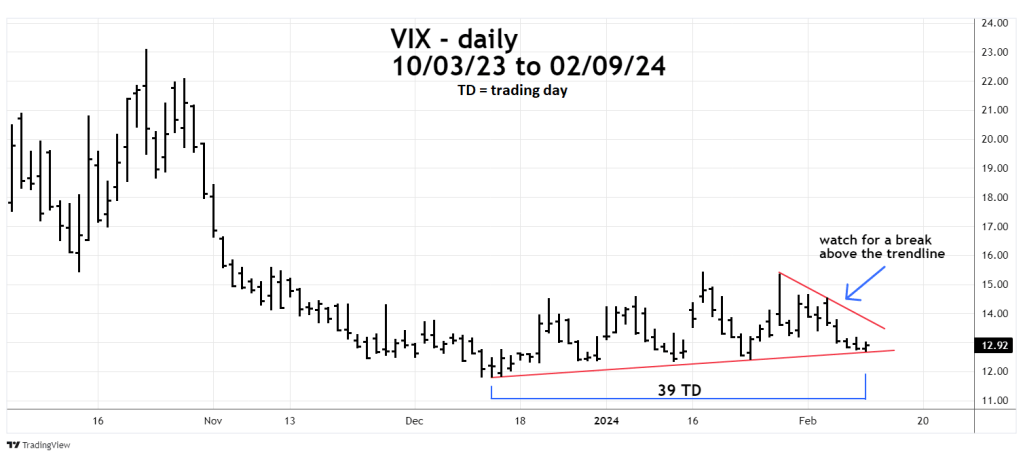
SPX bottoms can be identified by VIX spikes up. The VIX moves higher because of increased Put option buying. Traders/investors use Put options to hedge against declines.
Its reasonable to think that SPX tops correspond to VIX bottoms. This is not what’s been happening at significant SPX peaks.
Not all traders/investors are equal. The superior market players increase Put option purchases prior to an SPX top, resulting with VIX at a higher bottom while the SPX makes its ultimate top.
The most recent occurrence of this phenomenon happened in early 2022. The SPX made its final bull market top 41 -trading days after the VIX primary bottom. On 02/09/24 the VIX made a higher bottom 39 – trading days after its primary bottom.
Also note that on 02/09/24 the SPX closed the session rising .57% with the VIX ending the session up .94%.
Two actions to watch for. First, a VIX movement above the declining trendline from the 01/29/24 peak. Second, VIX exceeding the high at 15.40 made on 01/17/24. If both these events occur it could be a signal for a significant SPX decline.
