As stock bull markets progress, investor optimism grows and usually peaks near market tops. Correspondingly momentum wanes as the stock market climbs. Stocks discount the future, and the stocks of smaller/weaker companies are the first to falter in anticipation of economic weakness. The higher a stock index climbs the number of stocks participating in the rally decreases.
Near stock market peaks the stocks of the most powerful companies are the last to rise. At some point the stock valuations of these powerful companies move far above their company fundamentals. Eventually they decline.
In February 2024 the three main U.S. stock indices are being propelled higher by a small group of powerful stocks.
The weekly S&P 500 (SPX) chart courtesy of Trading View updates the long-term Elliott wave count.
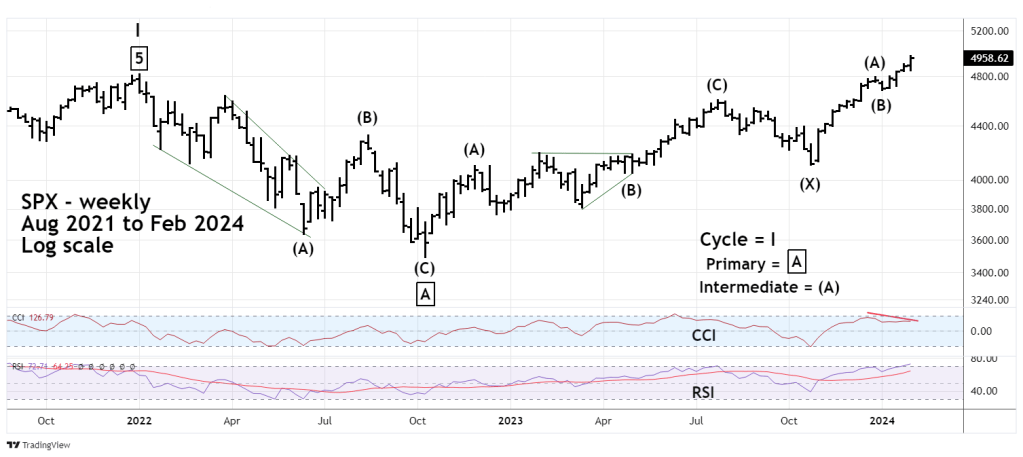
Several blogs on this website have illustrated that the SPX from the peak made in January 2022 could be forming an Elliott wave – Expanding Flat, this remains the most likely wave count.
Expanding Flats have three sub waves. The first wave itself is composed of three waves or a combination of three waves. In this case the January 2022 to October 2022 decline – Primary wave “A” is a Single Zigzag. The subsequent movement after the first wave is also composed of three waves or a combination of three waves. In this case the presumed Primary wave “B” is taking the form of a Double Zigzag. Wave “B” in Expanding Flats terminates marginally beyond the point of origin of wave “A”. The SPX has marginally exceeded the January 2022 peak.
The third and final wave of an Expanding Flat is composed of five waves and ends beyond the wave “A” termination point. In this case it’s the October 2022 bottom at 3,491.58. A possible downside target for Primary wave “C” is in the SPX 3,300 area. This target could be reached by late 2024 or early 2025.
Market Momentum
For several weeks both internal and external momentum for the main U.S. stock indices has been weakening.
On 02/02/24 while all three main U.S. stock indices were making new post October 2022 rally highs, only one of the eleven SPX sector – ETF’s made a new all-time high. That was the Industrial sector (XLI). Previously both the XLI and the Technology sector (XLK) were making new highs. Now even the XLK is diverging.
During the entire trading session on 02/02/24, the NYSE had more declining stocks than advancing. At the close of the session the NYSE had 33% of the stocks up vs. 65% down.
Considering the size of the SPX move up this is incredibly bearish. After SPX 02/02/24 session closed a follower sent me the following information from the “Sentiment Investor”
“The S&P 500 is up more than 1.25%. Fewer than 40% of issues on the NYSE are rising.
Since 1962, this is the most lopsided divergence ever”.
I have not verified this information, but it appears to be very plausible.
The daily NYSE – 52 – week lows chart ($MALN) courtesy of Barchart.com illustrates another perspective.

Recent blogs on this website have shown the growing bearish divergences of NYSE – 52 – week highs. On 02/02/24 this indicator had yet another bearish divergence.
What’s more shocking is that while the SPX is making new all-time highs the number of new NYSE lows is rising!
On 02/02/24 stop loss levels for the SPX short position initiated on 01/29/24 were hit at moves above 4,940 and 4,970. The total loss was 2.5%.
Traders work in the world of probabilities not certainties, low probability does not mean no probability.
The current market breath in terms of sectors and individual stocks rising could be the thinnest in U.S. stock market history.
Near – term the SPX could be making a run at 5,000. Or a top could have been made on 02/02/24. In either case the momentum evidence strongly implies this may not be the best time to enter long stock positions.
The degree of market evidence tends to correspond to the degree of a market turn. For the U.S. stock market, a deep move down could be coming very soon.
