The 01/25/24 blog “Basing for the Final Rally?” noted, “The DJI and SPX have the best chance of another all-time high being made on 01/26/24.”
On 01/26/25 the S&P 500 (SPX) and the Dow Jones Industrial Average (DJI) made all-time highs. This could be the final rally, and pinnacle of the U.S. stock bull market.
The 15 – minute DJI, SPX, and Nasdaq Composite (IXIC) chart courtesy of Trading View updates the intraday action.
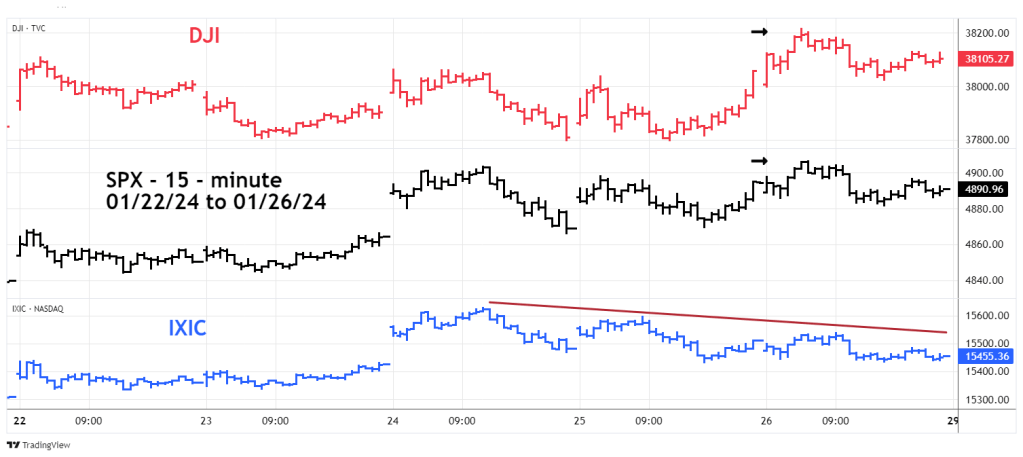
The most interesting aspect of this chart is that while the DJI and SPX were making new highs, IXIC was trending down.
Something different is happening.
When something different happens to a stock or a market it could signal a developing tend change.
From 1999 to 2000 U.S. Technology stocks were skyrocketing in a massive buying mania. The Nasdaq 100 (NDQ) has a high percentage of technology stocks and peaked in March 2000. The NDQ then declined 83.3% in a thirty-one-month bear market.
Then in October 2002 something different happened. On 10/08/02 NDQ made its ultimate bear market low. On 10/10/02 the SPX, DJI, and IXIC made their ultimate bear market lows. On 10/10/02 the NDQ which had been leading the way down in the bear market was now leading the way up. This was the birth of a five – year bull market for U.S. stocks.
The daily NDQ chart shows what’s happening now.

The NDQ still has a high percentage of Technology stocks. From October 2023 bottom NDQ has risen 25.7%.
The moves up for each of the three main U.S. stock indices are as follows.
IXIC up 24.5%
SPX up 19.5%
DJI up 18.2%
On the longer term NDQ is 5.3% above its November 2021 peak.
The IXIC has yet to exceed its November 2021 top.
SPX is 1.7% above its January 2022 top.
DJI is 3.3% above its January 2022 top.
In the most recent bull phase NDQ has been stronger than the three main U.S. stock indices.
But now something different is happening. On 01/24/24 NDQ made an all-time high yet failed to confirm the DJI and SPX all-time highs on 01/26/24.
The daily chart of the Technology sector Exchange Traded Fund (XLK) narrows the focus.
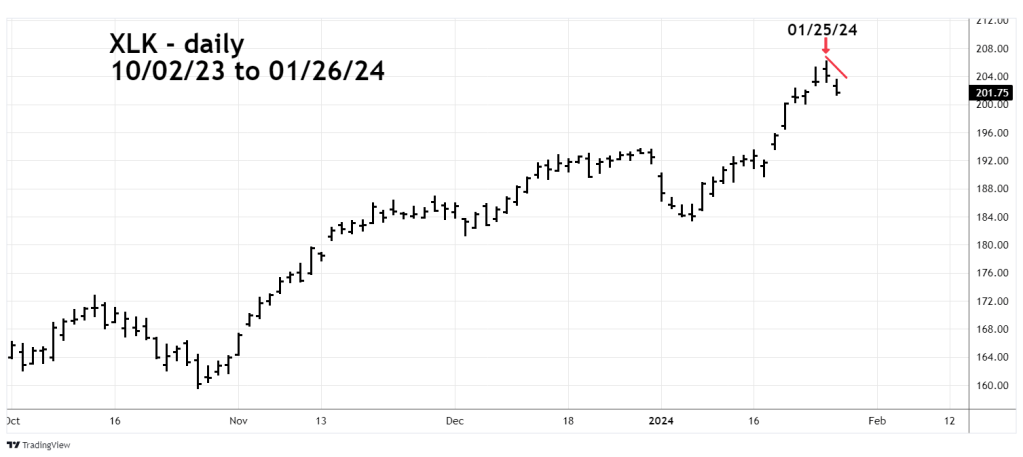
Since October 2023 XLK has gained 29.4% and has gone 16.3% above its December 2021 top.
The XLK bull market top occurred on 01/25/24 and failed to confirm the SPX and DJI highs on 01/26/24.
The daily NYSE new highs ($MADN) chart courtesy of Barchart.com updates internal momentum.
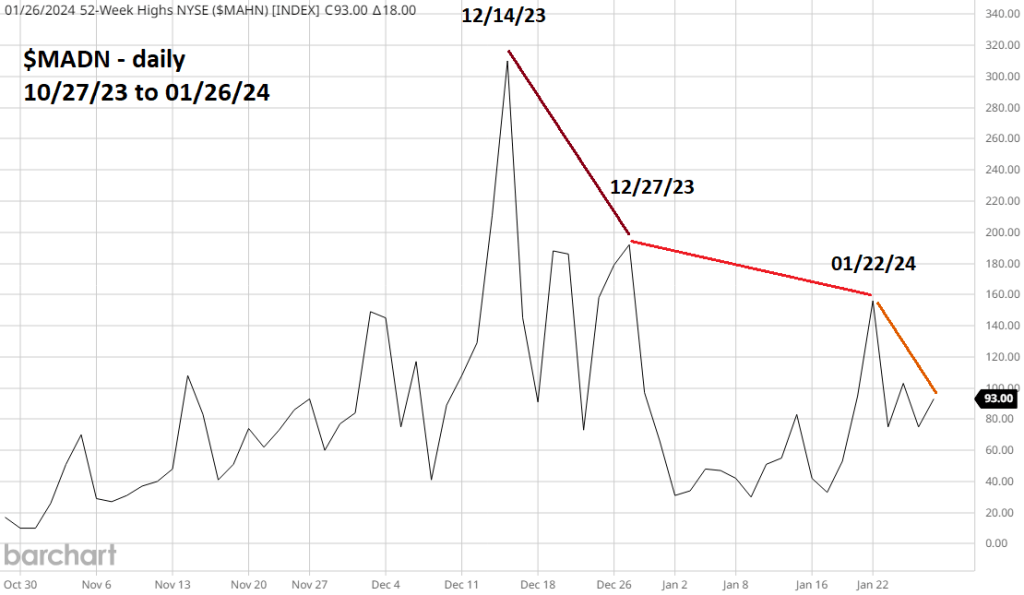
As the DJI and SPX continue to climb, fewer and fewer stocks are making new highs.
Time dimension: The 01/21/24 blog “S&P 500 – Fibonacci Time Cycles – 01/19/24” illustrated two potential cycle points on 01/18/24 and 01/19/24. As of 01/26/24 the cycle targeting 01/19/24 is outside the leeway zone. The cycle targeting 01/18/24 is still in the leeway zone.
There’s also another potential time cycle that could be signaling a market turn. Sometimes markets can turn on Full/New moons, plus or minus two trading days.
On 01/25/24 there was a Full moon.
A “Rule of the Majority” signal occurs when one of the three main U.S. stock indices makes a new high/low unconfirmed by the other two main indices. So far with two main U.S stock indices making new highs there is no signal. While this is a very effective indicator no indicator is perfect.
Its also possible a Rule of the Majority signal could occur in a few trading days or even a few weeks. Regardless of a Rule of the Majority signal, the weight of evidence strongly suggests a significant downturn in U.S. stock may have begun.
A summary of the evidence is as follows.
SPX in proximity to major Fibonacci resistance. Please see the 01/24/24 blog.
NDQ and TLK failing to confirm the DJI and SPX all-time highs on 01/26/24.
Massive NYSE new highs bearish divergences.
Fibonacci and lunar time cycles.
Traders initiate a 100% short position on non-leverage SPX funds at the open of the SPX session at 9:30 AM – ET 01/29/24.
Use a move above SPX 4,940.00 as a stop loss for half of the position. Use a move above SPX 4,970.00 as a stop loss for the second half of the position.
