On 01/19/23 the S&P 500 (SPX) surged up 1.23% and made a new all-time high. On the surface it appears this could be in the start part of another manic rally. An examination of U.S. stock market momentum suggests something else.
The daily S&P 500 – Advanced/Decline line ($SPXADP) chart courtesy of StockCharts.com updates its action.
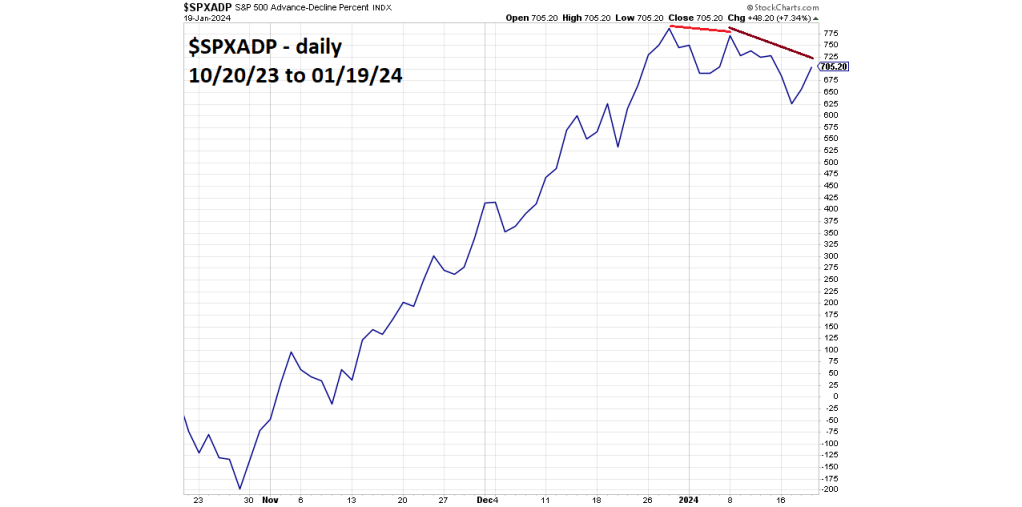
Normally $SPXADP closely tracks the performance of SPX. Note the $SPXADP peak occurred at the SPX 2023 high. On 01/19/24 $SPXADP failed to exceed even the most recent bearish divergence made on 01/12/24 – the prior SPX top.
The S&P 500 – Bullish Percent index ($BPSPX) chart, also courtesy of StockCharts.com updates this internal momentum indicator.

The Bullish Percent Index, is a breadth indicator that shows the percentage of stocks on Point & Figure buy signals. This is an indicator that goes deep under the surface of price action.
The current reading from $BPSPX is shocking! Since late 2023 $BPSPX has been trending down, ignoring the rally from the SPX 01/05/24 bottom. The $BPSPX move up on 01/19/24 was insignificant. Anyone doing the “bull dance” because the SPX made a new all-time high – please look at this indicator.
The NYSE – 52 – week Hi – Lo ($MADN) chart courtesy of Barchart.com updates its action.
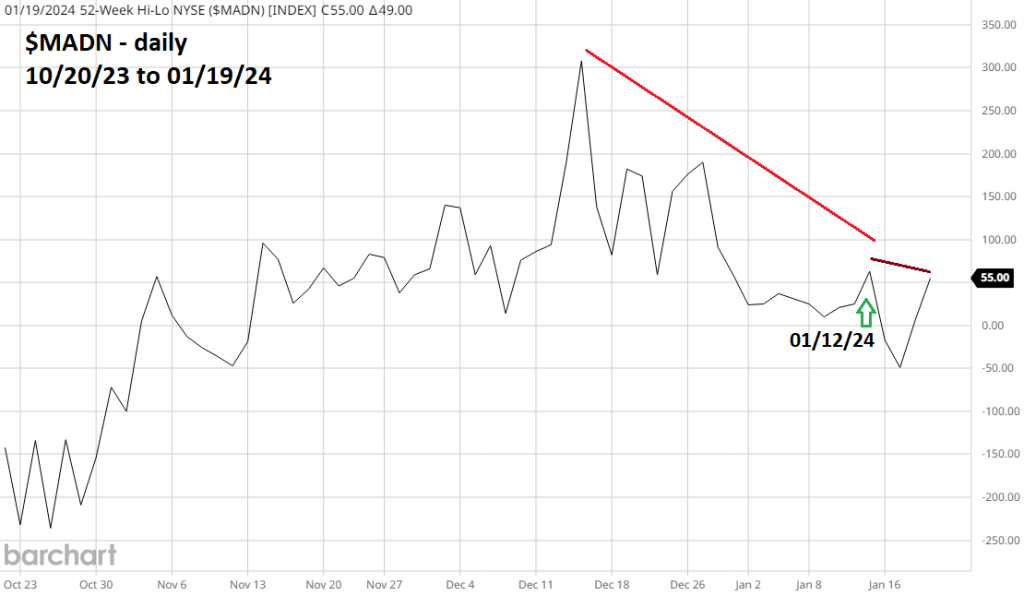
This indicator now has a double bearish divergence vs. its mid-December high. Again, note that in spite of the SPX surge on 01/19/24, $MADN failed to exceed the 01/12/24 peak.
The daily SPX chart courtesy of Trading View updates its Elliott wave count.
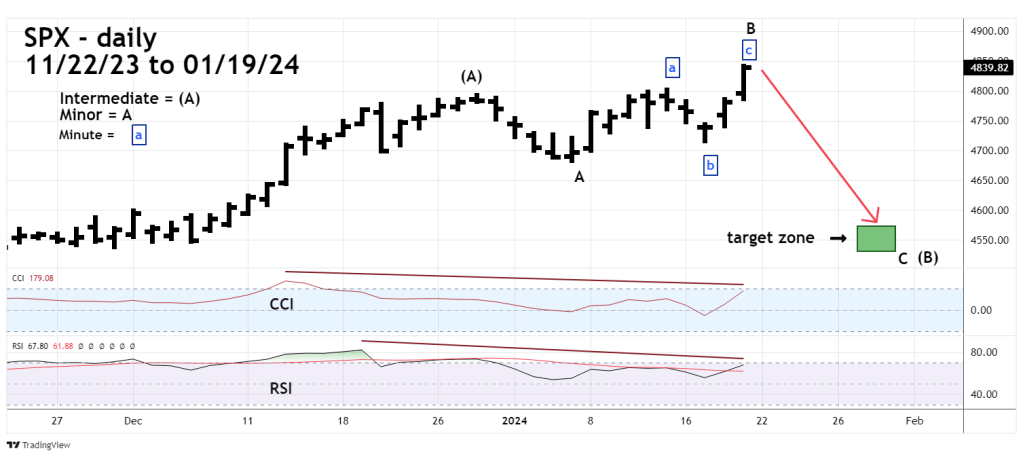
The 01/14/24 blog “S&P 500 – Short – Term Elliott Wave Count – 01/12/24” illustrated that the SPX could be forming an Expanding Flat correction from the 12/28/23 high. This is still the most likely wave count. The only difference from the prior wave count is the subdivisions of the presumed Minor wave “B” are visible on the daily scale.
Note the continuing RSI and CCI bearish divergences.
The downside target for the presumed Minor wave “C” is still in the mid – 4,500 area which could be reached in late January.
Traders stopped loss at SPX 4,830 on half of a SPX short position initiated at the SPX session open on 01/02/24. The loss of half of the position was 0.90%. Continue to hold the second half with a stop loss at 4,860.00.
A common characteristic of late-stage stock bull markets are bearish divergences. Sometimes there can be more than one bearish divergence before the voracious appetite of the bulls can be satisfied.
There are two Fibonacci time cycles that could determine when the next U.S. stock market downturn may happen.
The next blog will examine these time cycles.
