The 01/14//24 blog “S&P 500 – Short-Term Elliott Wave Count – 01/12/24” illustrated that an Elliott Wave – Expanding Flat correction was probably developing and noted.
“There’s a good chance the third wave – Minor wave “C” began at the SPX high on 01/12/24”.
The S&P 500 (SPX) high on 01/12/24 has held, increasing the chance that Minor wave “C” – down is developing.
The daily SPX chart courtesy of BigCharts.com illustrates momentum.
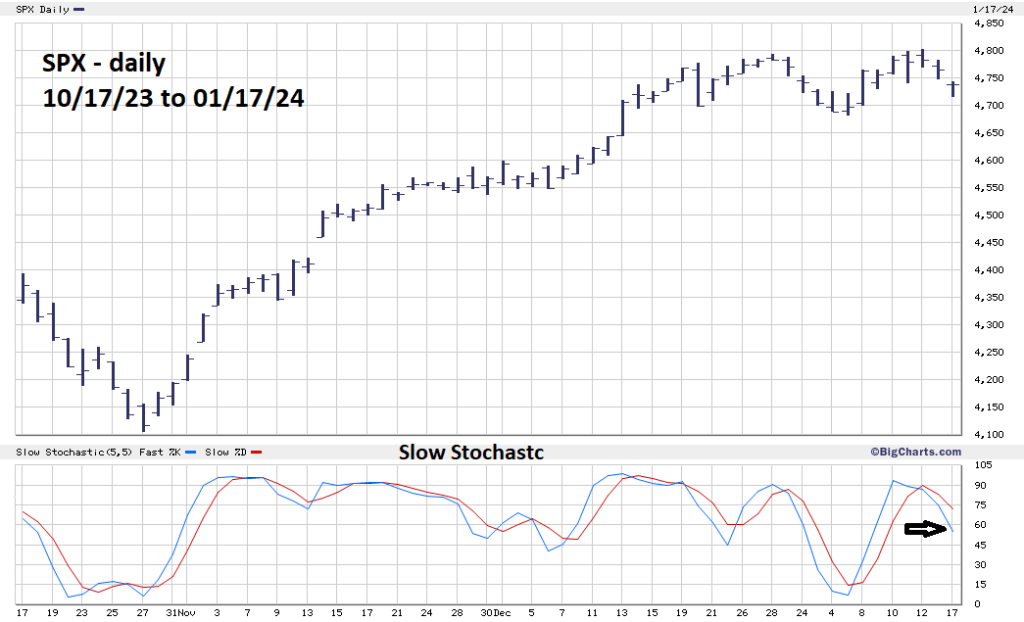
BigCharts.com Slow Stochastic is very effective. Both lines are in the upper neutral zone implying at least several trading days of decline before reaching the oversold zone.
The 01/04/24 blog “First Support for the S&P 500” illustrated potential SPX – Volume Profile support.
The SPX – two – hour chart courtesy of Trading View updates this indicator.
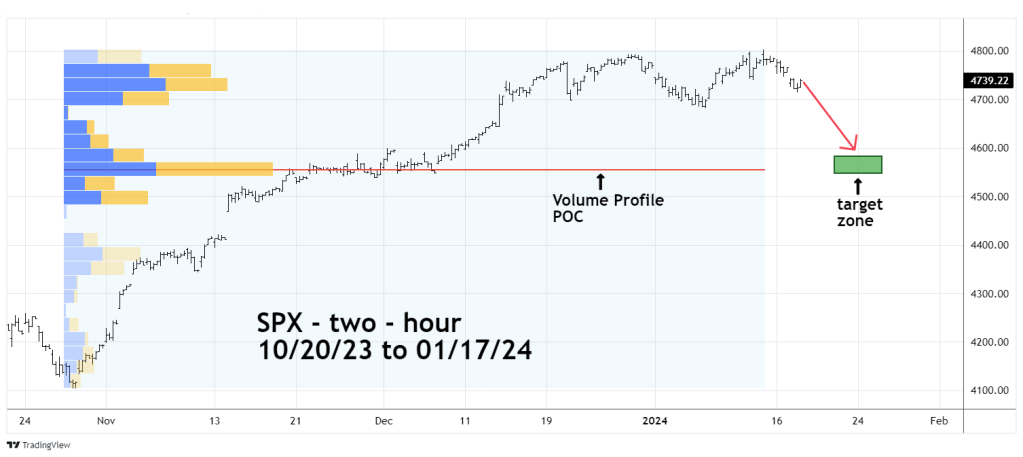
Volume Profile shows volume vertically and indicates volume relative to price. Volume clusters tend to act as support/resistance. The widest volume cluster is called “Point of Control” (POC) and is usually the strongest support/resistance zone.
There’s a good chance the SPX could reach the support zone of 4,540 to 4,580 sometime between 01/22/24 and 01/25/24.
