There are always alternate Elliott wave counts. To determine the most likely path requires analysis of market momentum and sentiment. Recent momentum readings continue to suggest a short-term decline to at least the S&P 500 (SPX) 4,550 area.
Recent blogs on this website have illustrated the bearish momentum messages from the S&P 500 – Bullish Percent Index ($BPSPX) and the NYSE – 52 week Hi – Lo ($MADN).
The daily S&P 500 – Advance/decline chart ($SPXADP) courtesy of StockCharts.com shows another perspective.
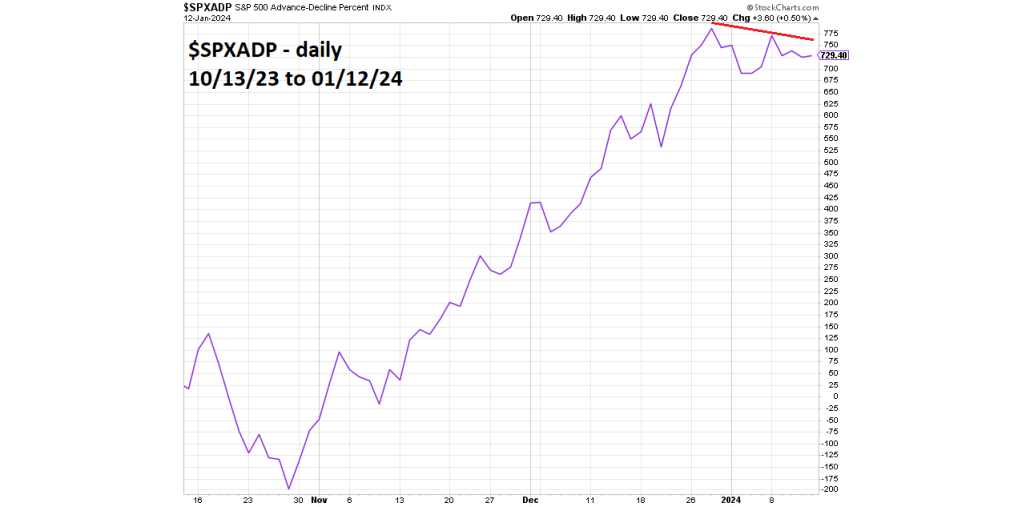
Normally the $SPXADP closely follows the SPX. On 01/12/24 there was a double bearish divergence vs. the 12/28/23 reading which matched the then high point of the SPX October to December rally.
The hourly SPX chart courtesy of Trading View shows the most likely Elliott wave count.
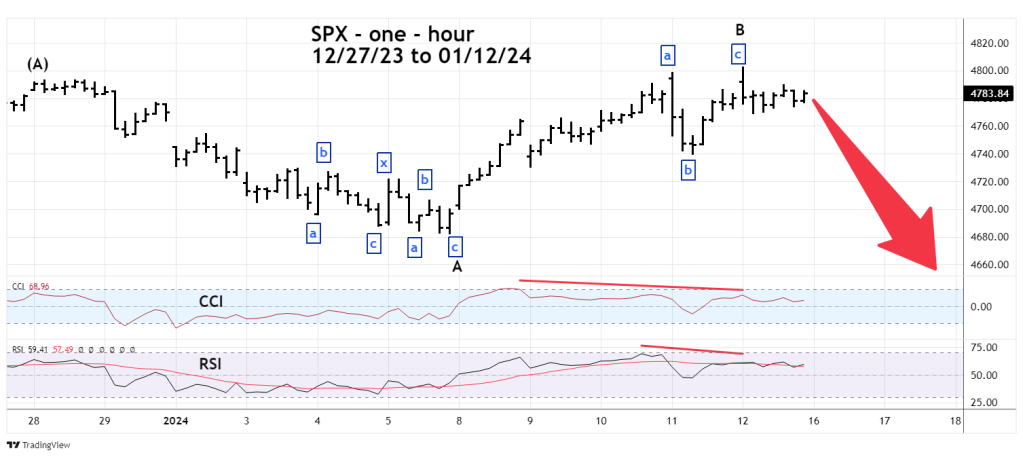
At the most recent SPX high on 01/12/24 both hourly CCI and RSI had bearish divergences.
There’s a high probability that since 12/28/23, the SPX is forming an Elliott wave Expanding Flat corrective pattern.
In this structure the first wave is composed of three waves or a combination of three waves. In this case Minor wave “A” is a Double Zigzag.
The second wave is also composed of three waves or a combination of three waves and marginally exceeds the point of origin of the first wave. In this case – the 12/28/23 peak.
The third and final wave is composed of five waves that exceed the termination point of the first wave. In this case the 01/05/24 bottom.
There’s a good chance the third wave – Minor wave “C” began at the SPX high on 01/12/24.
If so the next decline could continue until 01/22/24 or 01/23/24.
