The prior blog noted the S&P 500 (SPX) could find support near the 4,550 area. The intraday SPX – Elliott intraday wave count and momentum indicators suggest a brief bounce could develop.
The SPX – 15 – minute chart courtesy of Trading View zooms in on the Elliott wave count from the 12/28/23 high.
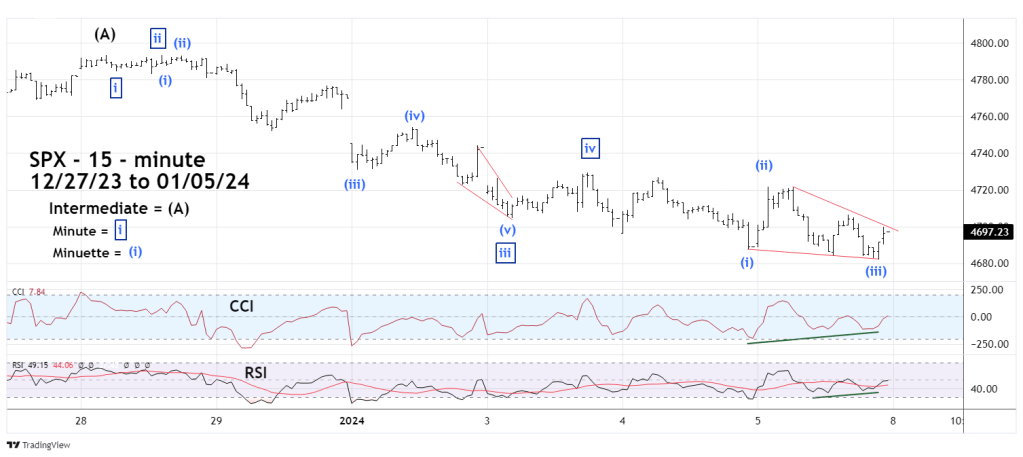
Note the CCI has a bullish divergence off of the 01/04/23 bottom. RSI has a double bullish divergence.
The decline from the 01/03/24 high appears to be an Elliott wave – Ending Diagonal Triangle, which are found at the termination point of larger patterns. In this case – the fifth motive wave down from the 12/28/23 high. If this wave count is correct there could be a move down on 01/08/24 that goes below the 01/05/24 low to complete the pattern.
There’s also an alternate wave count that suggests a minor bottom was made on 01/05/23. If on 01/08/24 there’s no move below the 01/05/24 low, the bounce is probably developing.
The daily SPX chart courtesy of BigCharts.com examines the larger view.

The BigCharts.com – Slow Stochastic is very effective in catching turns. Both Slow Stochastic lines have reached the oversold zone, supporting the intraday momentum evidence of a near term bounce.
Note the daily RSI is below the reading it had on 12/06/23. Sometimes when this phenomenon occurs RSI could be predicting price destination. The SPX closing price on 12/06/23 was 4,549. The widest part of “Volume Profile” support illustrated in the prior blog was 4.550.
If a bonce occurs it may only last for one or two trading days and not likely to exceed the SPX 12/28/23 high.
Traders are short 100% SPX related non – leveraged funds from the SPX open on 01/02/24. Continue holding short. For those not short the SPX or wish to add on to short positions, a bounce could provide an opportunity.
