An intermediate bottom for 30 – year U.S. Treasury Yields could be in place.
The weekly CBOE 30 YR Treasury Bond Yield (TYX) chart courtesy of Trading View illustrates the long- term Elliott wave count.
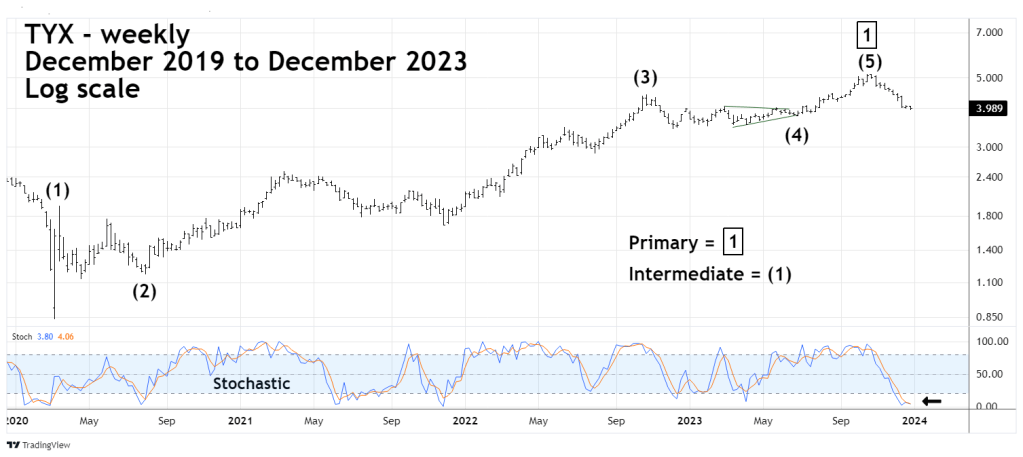
The TYX move up from March 2020 to October 2023 appears to be a completed Elliott wave – Impulse pattern. If so, this implies at least a multi month decline to correct the 2020 to 2023 bull move.
Note the weekly Stochastic has gone deep into the oversold zone, suggesting a multi – week rally may have begun.
The daily TYX chart zooms in on the October to December decline.
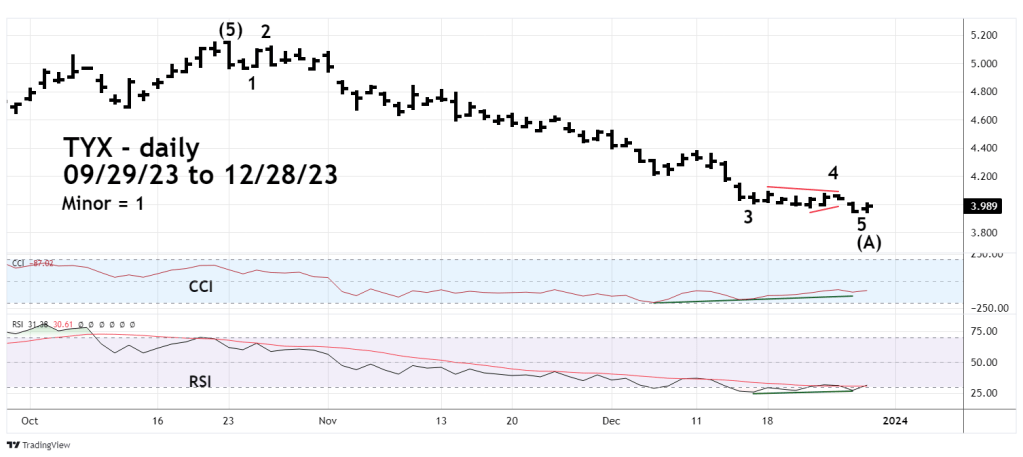
The move down from October 2023 has a smooth and steady look of an Impulse pattern.
Double bullish divergences on RSI and CCI support the theory that Intermediate wave (A) could be complete.
The next phase up – Intermediate wave (B) may have started on 12/27/23. If so the rally could continue for several weeks and probably not exceed the October 2023 high.
A rough guess of when the presumed multi- month correction could end is March of 2024.
U.S. stock market participants are bullish because of expected FOMC short – term interest rate cuts in 2024. There’s a good chance the FOMC could make rate cuts in 2024. They have no control over long-term rates. If the long-term Elliott wave count is correct the TYX decline could be relatively brief.
The October 2023 TYX peak could be the first part of a rally lasting several years.
