Today 12/20/23 the S&P 500 (SPX) had its fastest and deepest decline since the U.S. stock buying mania began on 10/27/23. When something different happens it usually means a developing trend change.
In this case an intermediate decline that could continue for several days or a few weeks.
The 3 -hour SPX chart courtesy of Trading View illustrates the Elliott wave count since the 10/27/23 bottom.
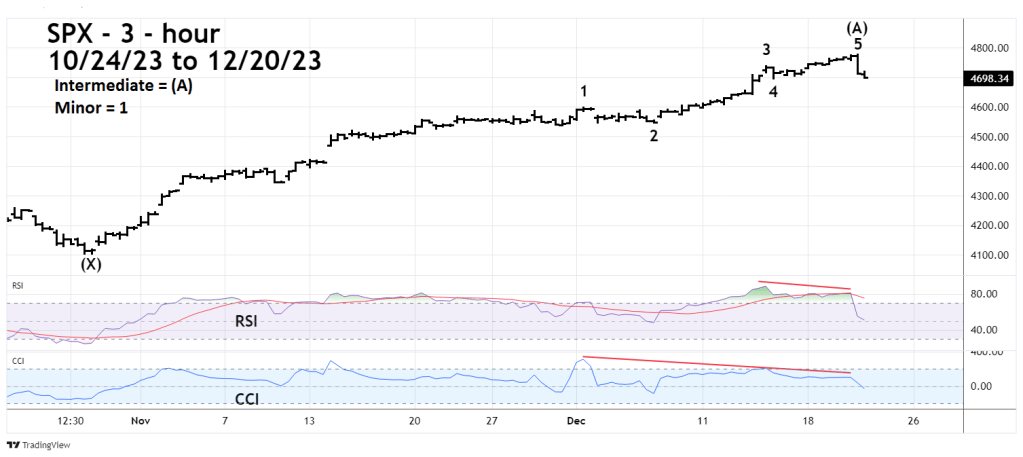
Note the steady and smooth movement since 10/27/23, this is the signature look of an Elliott Impulse wave.
3 – hour RSI peaked deep in the overbought zone and had a bearish divergence also in the overbought zone.
CCI had a double bearish divergence.
The SPX 15 – minute chart zooms in on the presumed Minor wave “5” of the Impulse pattern.

The movement from the 12/14/23 bottom sub divides into a lower scale impulse pattern. The momentum readings on RSI and CCI both had multiple bearish divergences.
Also note the extreme oversold RSI reading near the low of the SPX 12/20/23 decline. The 15 – minute CCI was rising. This non-confirmation indicates the 12/20/23 SPX decline could be at or near exhaustion.
The next SPX chart illustrates a bearish divergence on the daily scale.

Both the daily RSI and CCI hit peaks on 12/13/23. Then for the next four trading days RSI continued to rise deeper into the overbought zone while CCI declined.
The 12/20/23 drop moved the daily RSI below its moving average line – another bearish signal.
The U.S. stock market is entering what’s usually a slow holiday trading period that lasts until the end of the year. If the decline continues it may be slow and choppy. Dynamic movements up or down may not happen until the first trading session of 2024.
