The 11/26/23 “Time Cycle Turn late November 2023” examined a potential S&P 500 – Fibonacci time cycle based on prior peaks and noted.
“The week beginning 02/18/20 to the week beginning 01/03/22 is 98 – weeks. Projecting 98 – weeks from 01/03/23 targets the week beginning 11/20/23. On this time scale a leeway of one or two weeks is acceptable.”
The S&P 500 (SPX) post – 10/27/23 rally high was on 12/01/23 within leeway of the Fibonacci time cycle.
The SPX two – hour chart courtesy of Trading View illustrates the short – term Elliott wave count.
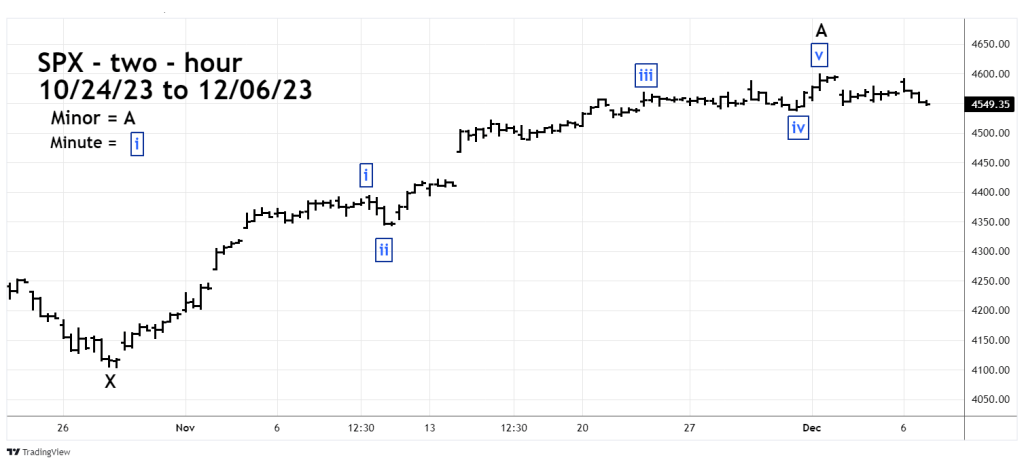
This wave count implies a correction of the 10/27/23 to 12/01/23 rally has begun.
The daily SPX chart shows the action of the RSI oscillator.
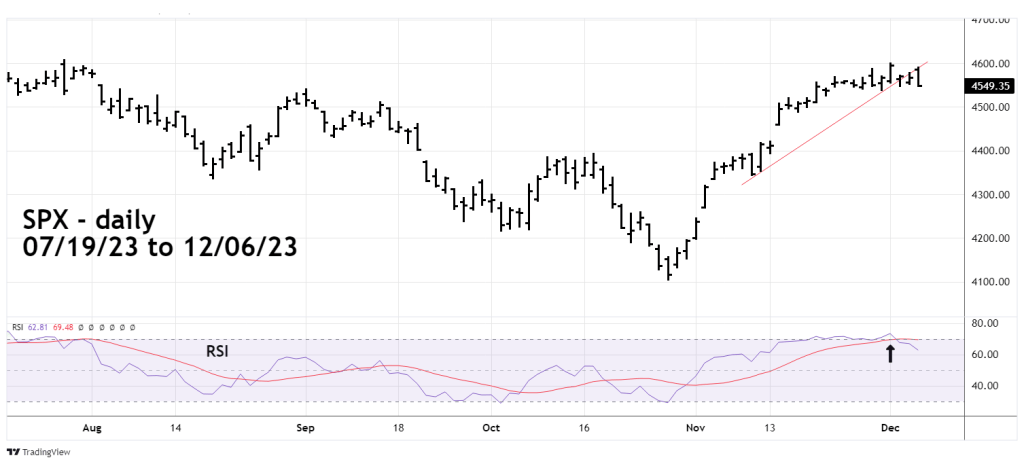
The SPX 12/01/23 high corresponds to the highest RSI reading of the 10/27/23 to 12/01/23 rally. Most of the time stock indices will make important peaks with at least one daily RSI bearish divergence. The maximum RSI reading on 12/01/23 implies a decline then a rally above the SPX 12/01/23 peak.
Caution, there is a possibility a major rally peak occurred today 12/06/23. The Dow Jones Industrial Average made a post 10/27/23 rally high today unconfirmed by the other two main U.S. stock indices. This is a “Rule of the majority signal” which happens when one of the three U.S. main stock indices makes a new high or low unconfirmed by the other two main indices.
“Rule of the majority” signals can come at major or intermediate turns.
Also note the break below the rising trend line connecting the 11/09/23 and 11/30/23 bottoms. Subsequently the SPX rallied and found resistance at the former support line.
If an intermediate decline is underway it may only last two – weeks. The next U.S. – FOMC decision on short-term interest rates is 12/13/23.
