Today 11/08/23 the Dow Jones Industrial Average (DJIA) 200 – day moving average (MA) and its 50 – day MA were only 39 – points apart. On 11/07/23 the lines were 55 – points apart. A move of the 50 – day MA below the 200 – day MA – know as a “Death Cross” could happen in one or two trading days.
The DJIA daily chart courtesy of BigCharts.com updates the action.
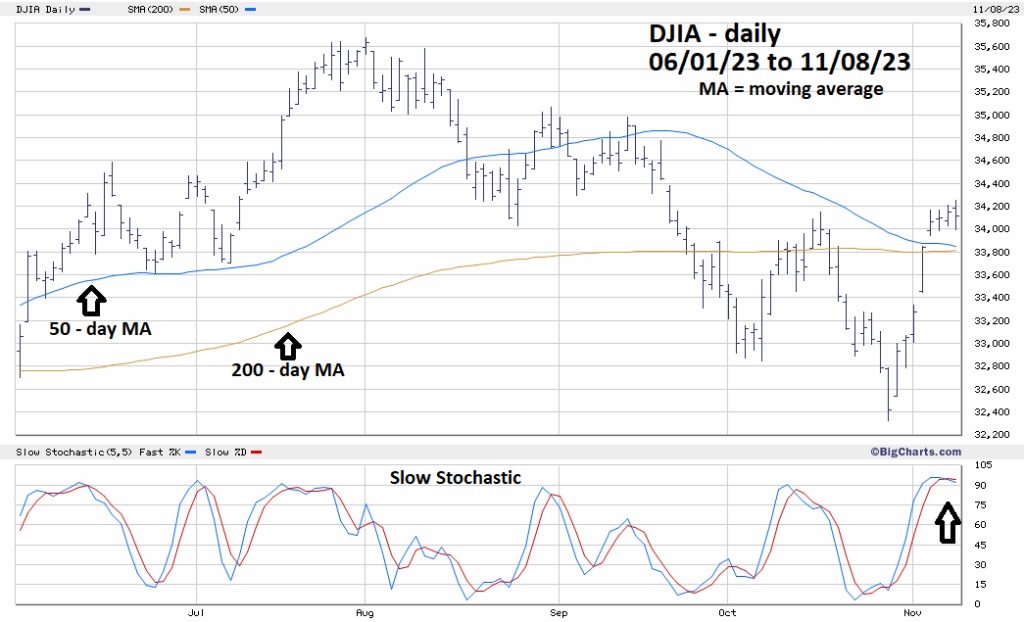
Today the daily Slow Stochastic had a bearish lines cross in the overbought zone indicating at least a multi-day decline has probably begun.
A “Death Cross” could trigger a drop that bottoms above the DJIA 10/27/23 low.
The next most likely scenario could be a mini crash of 10 to 14%.
Seasonal patterns and short-term momentum favors a drop that bottoms above the 10/27/23 low.
Watch for a DJIA “Death Cross”.
