Stock market bottoms prior to at least multi- month rallies occur in two ways. After a sudden and sharp decline, such as the 2020 crash. Or after a multi month drop like the January to October 2022 bear phase. The sentiment and momentum readings from U.S. Stocks in late October 2023 provide insight to the post 10/27/23 rally.
The weekly VIX chart courtesy of Trading View examines evidence from the dimension of sentiment.
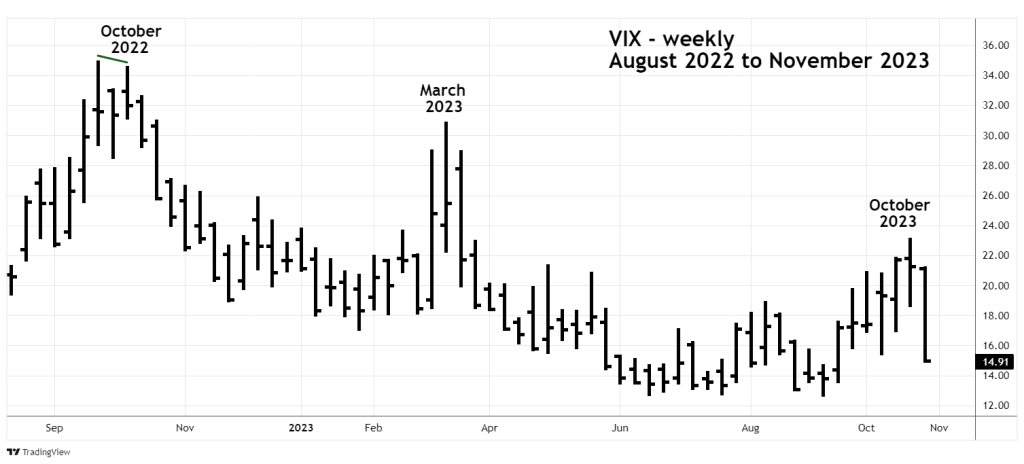
The S&P 500 (SPX) volatility index – VIX is effective in identifying intermediate or major SPX bottoms. VIX upward spikes usually correspond with SPX bottoms. The VIX level is also useful in determining the degree of a potential bottom, higher VIX readings tend to correspond with high fear/strong bottoms.
Comparing the VIX October 2023 reading with October 2022 we can see the most recent reading is far below the October 2022 reading. Additionally, the October 2022 reading was below the September 2022 level made at a higher SPX bottom. That’s a sentiment divergence occurring at a relatively high level – powerful evidence of an important SPX bottom.
The weekly VIX in October 2023 reached a relatively low level without a divergence.
The NYSE – 52 – week lows chart courtesy of BarChart.com illustrates internal U.S. stock market momentum.

There’s a dramatic difference in 2023 new lows vs. 2022 new lows. The October 2022 reading had a significant divergence vs. September 2022. Late October 2023 had a marginal divergence vs. the early October 2023 reading.
The weekly SPX chart illustrates external momentum indicators.

In June 2022 the SPX – weekly RSI reached the boundary of the oversold zone at 30%. When the SPX reached its ultimate bottom in October 2022 the weekly RSI had a double bullish divergence. In October 2023 the SPX – weekly RSI only reached 40% without a divergence.
In October 2022 MACD – Histogram and lines had bullish divergences. In October 2023 Histogram had no bullish divergence and the lines haven’t even gone below the “zero” level.
Seasonal patterns for stocks are bullish in November. The sharp move up from the 10/27/23 bottom looks like an Elliott Impulse wave. If so, it could be the first part of a three-wave rally into mid or late November 2023.
The rally could of course continue longer. Keep in mind that the sentiment and momentum readings of late October 2023 were not at the levels you would expect prior to a multi – month rally. The readings suggest only a multi-week move up.
There’s also an outside chance that a Dow Jones Industrial Average “Death Cross” could trigger a mini crash.
Bulls need to be cautious, a U.S. stock rally into late 2023 could be anemic.
