The U.S. stock rally from 10/27/23 could be the first phase of a bull move into late November 2023. Momentum evidence implies a move down during the week of 11/06/23 to 11/10/23.
The daily Dow Jones Industrial Average (DJIA) chart courtesy of BigCharts.com updates the potential “Death Cross” and momentum.
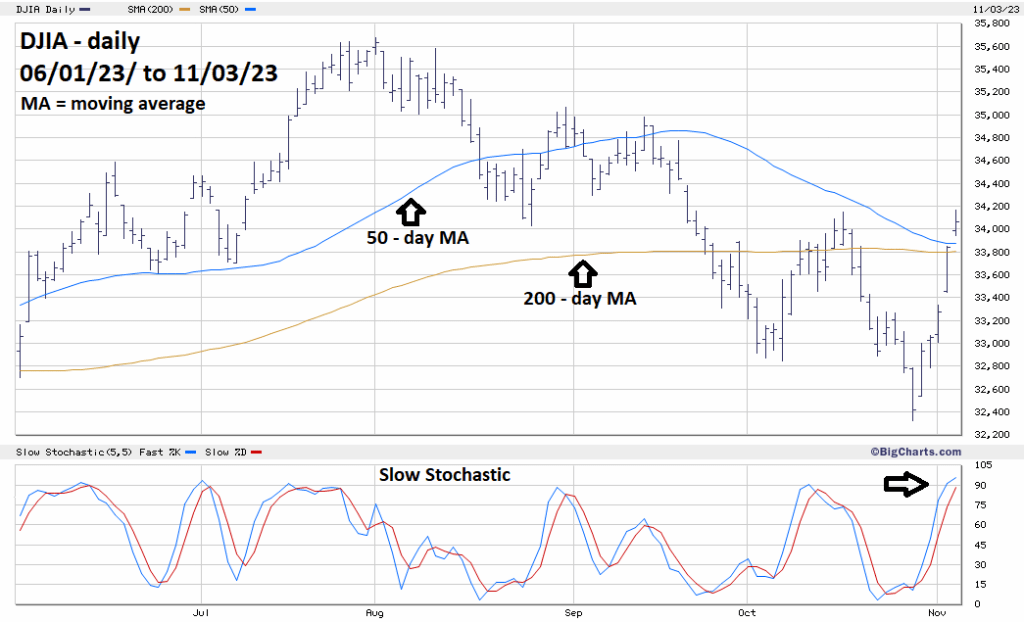
On 11/03/23 the DJIA – moving average lines continued to converge. On 11/02/23 the lines were 80 points apart, on 11/03/23 they were 75 points apart. It’s possible a “Death Cross” could happen next week. Considering the strength and persistence of the DJIA rally since 10/27/23 there’s a good chance a “Death Cross” could signal a higher bottom above the 10/27/23 low. This phenomenon occurred at the DJIA bottom on 03/08/22, noted in the 10/28/23 blog “An Approaching Death Cross”.
Both lines of the Slow Stochastic have gone above the overbought boundary of 80%, implying a short-term top.
The one – hour S&P 500 (SPX) chart courtesy of Trading View shows the intraday momentum.
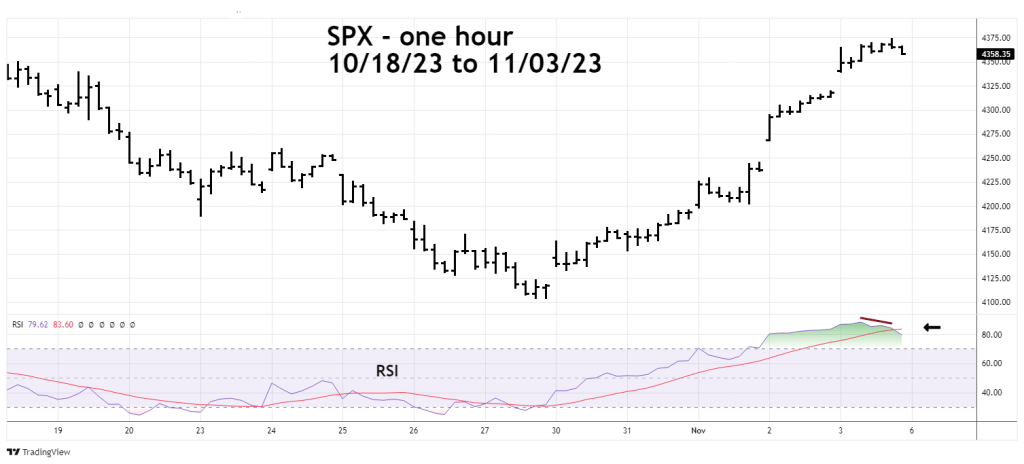
Hourly RSI has gone deep into the overbought zone with a bearish divergence. Additionally, RSI has crossed below its hourly moving average. The intraday momentum combined with the daily momentum evidence strongly implies a decline into the next week.
Traders were recommended to short non-leveraged SPX funds at the open of the main trading session on 10/13/23 with the first stop loss at 4,402.00. If the stop loss is not hit, a recommendation to exit the position will likely be made sometime in the next week.
