For more than one year there’s been an inverse relationship between U.S. utility stocks and U.S. interest rates. When interest rates rise utility stocks decline. The Dow Jones Utility Average (DJU) could soon be signaling an important U.S. interest rate peak.
The 09/21/23 blog “Upside Target for U.S. Treasury Yield” noted that U.S. 30 – year treasury yields (TYX) had major Fibonacci resistance at 5.665. The recent TYX high is 5.152 and could reach 5.665 or get near it within the next one or two weeks.
The weekly TYX and DJU chart courtesy of Trading View illustrates the relationship.

Note the TYX top in October 2022 came close to the DJU bottom. The situation could occur again in early November 2023.
The weekly DJU chart details a fascinating Elliott wave pattern.
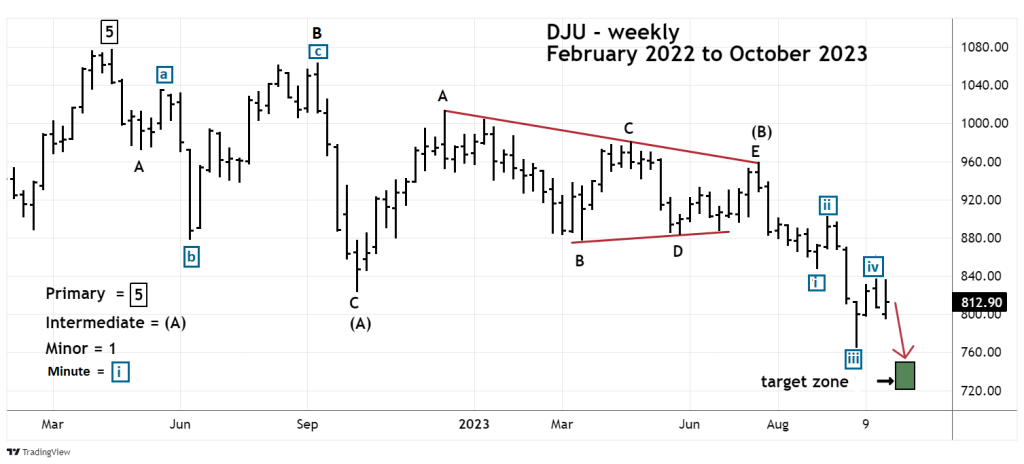
The DJU looks like it could be nearing the completion of an Elliott wave Double Zigzag correction from its April 2022 peak. The mid portion labeled Intermediate wave (B) is a Horizontal Triangle. The move down after wave “E” of the Horizontal Triangle appears to be a developing five – wave Impulse pattern. If so the fifth wave is probably underway.
Equality between waves “one” and “five” of Impulse patterns is a common Fibonacci relationship. The presumed Minute wave “i” – boxed was 111.07 points. Subtracting 111.07 from the presumed Minute wave “iv” top of 836.26 targets 725.19. The broad target zone is 750 to 720.
If this target is reached it may only be Minor wave “A” of a still developing second Zigzag down. This could extend the DJU decline for a few weeks.
There’s also an alternate wave count in which the second Zigzag is complete as of the 10/03/23 bottom at 765.47. In this scenario the DJU could decline, but not exceed the low at 765.47.
Whatever scenario is developing watch the DJU, it could help discover an important peak for U.S. interest rates.
