Today 10/26/23 all three main U.S. stock indices made new post July 2023 decline lows; the drop could continue into at least early November.
The daily S&P 500 (SPX) chart courtesy of Trading View updates the action.
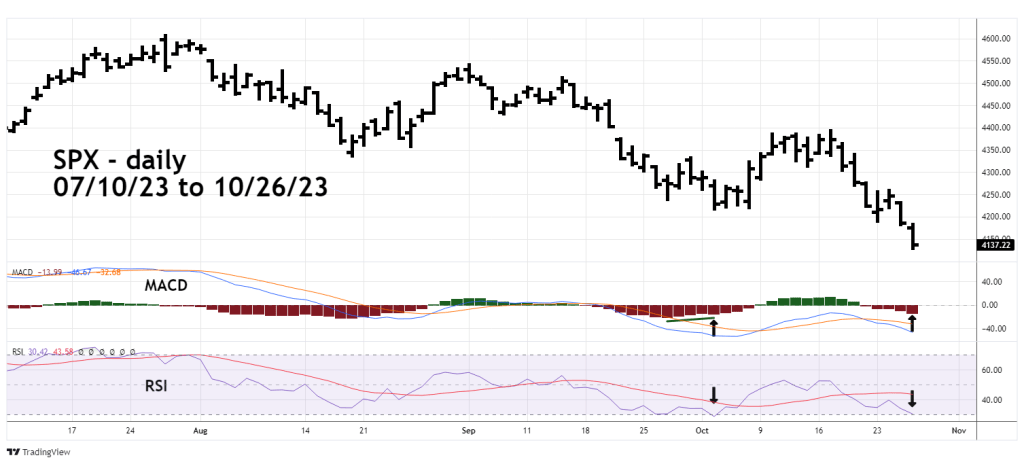
The 10/25/23 blog “Support Breaks Without a Panic” noted there was a bullish SPX – RSI divergence vs. the 10/03/23 bottom. At the close on 10/26/23 the bullish divergence was nearly eliminated. The RSI reading today was 30.42 vs. 28.66 on 10/03/23.
Daily MACD – Histogram has a similar message; its reading today was minus – 13.99 vs. a minus – 15.61 reading on 10/03/23. Elimination of these bullish momentum divergences could open the door for lower SPX prices.
The weekly SPX chart examines Fibonacci retracement levels.

The first area to watch for a potential bottom is at the Fibonacci .50 retracement of the October 2022 to July 2023 rally. The line is very close to short – term bottoms at 4,049.35 and 4,048.28 made in late April and early May 2023.
The next level to watch is the Fibonacci .618 retracement of the October 2022 to July 2023 rally. This line crosses near the 05/24/23 bottom at 3,909.16.
If a mini- crash develops the SPX could smash back down the bottom made in October 2022.
So far there is no weekly MACD – Histogram bullish divergence.
The weekly RSI is at 39.81, the oversold zone begins at 30.00.
The next U.S. – FOMC decision on short-term interest rates is 11/01/23.
