The SPDR – Consumer Staples Select Sector fund (XLP) is usually one of the most bullish sectors in the U.S. stock market. During 2023 it’s performance relative to the general stock market has been bearish. XLP’s recent action indicates U.S. stocks could continue declining into early November 2023.
The weekly XLP chart courtesy of BigCharts.com shows the big picture.
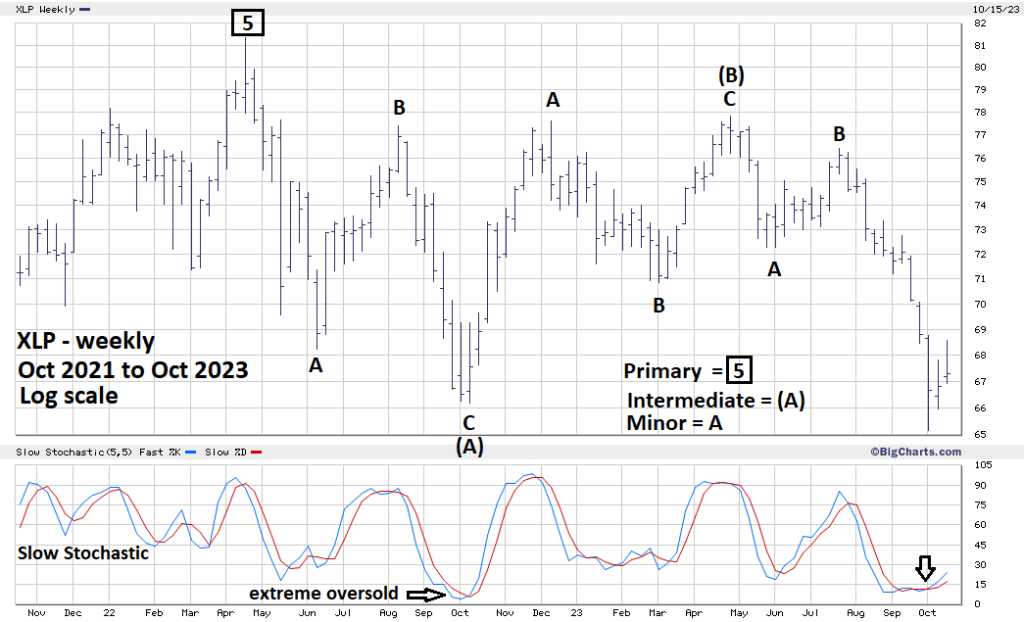
The XLP made its all-time high in April 2022, three months after the S&P 500 all-time high. XLP is composed of companies that make essential products, its typical for the stocks of those companies to peak after a broader stock market top.
From an Elliott wave perspective, the action after April 2022 appears to be a classic Double Zigzag correction. Note recently XLP went below its October 2022 bottom.
Weekly Slow Stochastic is inconclusive. In October 2022 XLP became extremely oversold. At the October 2023 bottom Stochastics bottomed at a higher level. Its possible XLP is in the process of becoming extremely oversold. However just after the recent bottom there was a bullish lines cross.
Examination of the daily XLP chart indicates there could be a move to new lows.
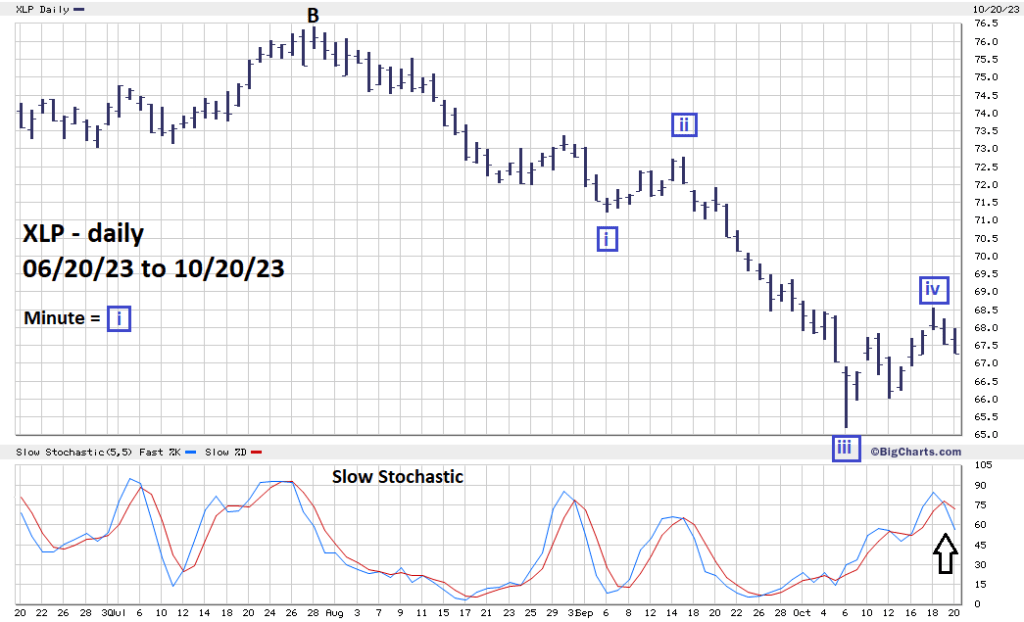
The rally from 10/06/23 to 10/18/23 labeled Minute wave “iv” looks very much like a Single Zigzag correction. Within Zigzag’s the most common Fibonacci relationship is equality of waves “a” and “c”. The presumed wave “a” of Minute wave “iv” is 2.65 points. The presumed wave “c” is 2.56 points.
The daily Slow Stochastic supports the theory that the presumed Minute wave “iv” rally is complete. There was a bearish line cross shortly after the 10/18/23 top.
If a new decline is underway it could continue into early Novembers. The next U.S. – FOMC decision on short-term interest rates is due on 11/01/23.
An XLP move below its 10/06/23 low could set up a significant bottom for itself and the broader U.S. stock market.
