Today 10/19/23 the yields for 5, 10, and 30 – year U.S. government debt made new 2023 highs. Correspondingly U.S. stocks as represented by the S&P 500 (SPX) declined .85%.
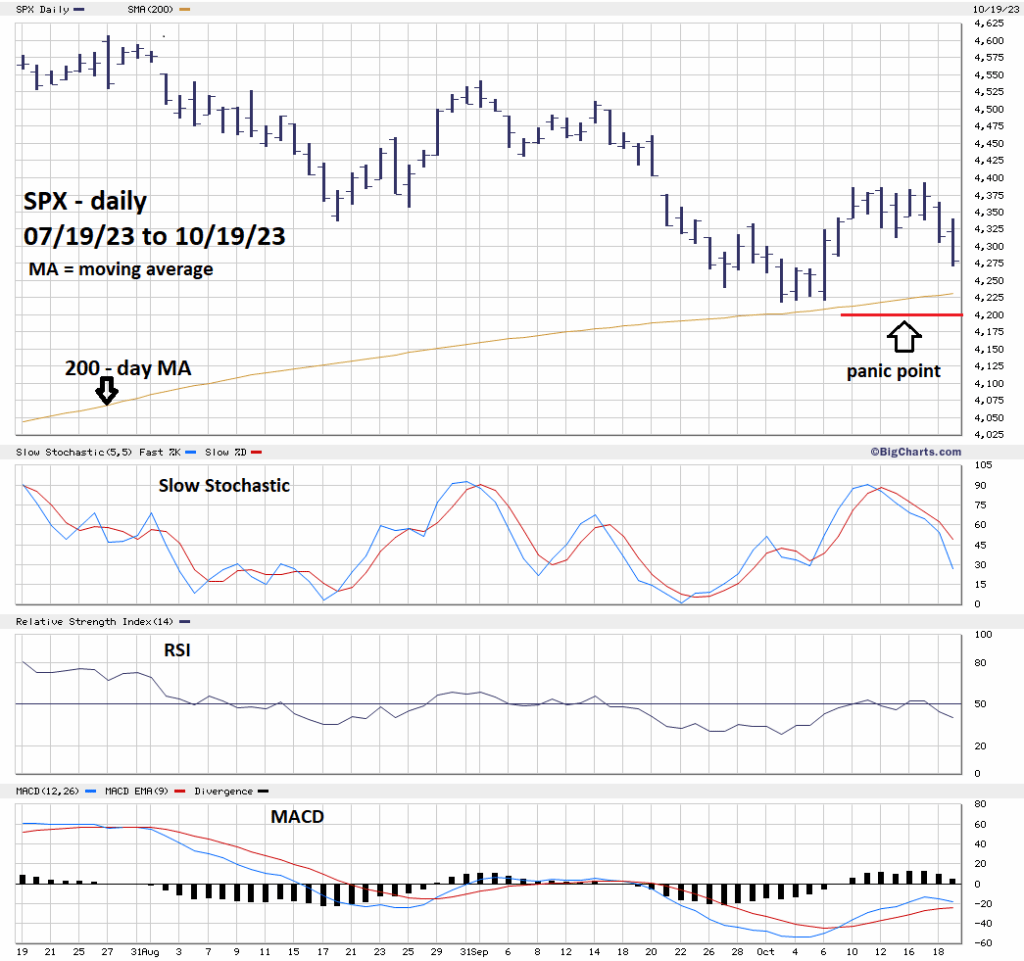
The daily SPX chart courtesy of BigCharts.com illustrates the action.
At the SPX low on 10/19/23 it had retraced .699 of the rally from 10/03/23 to 10/17/23. The decisive break below .618 Fibonacci support opens the door for a move down to the next Fibonacci support near the 10/03/23 bottom. This would be the Fibonacci equality ratio – the decline equaling the 10/03/23 to 10/17/23 rally.
Daily Slow Stochastic is in the neutral zone.
RSI is well above the oversold zone which begins at 30%.
MACD has not had bearish lines cross.
In the next few trading days, the SPX could easily reach the 4,200 to 4,216 area. If the SPX reaches that zone perhaps the bulls could form a double bottom.
A break below both the SPX – 200-day MA, and support at 4,216 could trigger a mini crash.
The U.S. FOMC – short – term interest rate decision is due on 11/01/23.
