Today 10/18/23 the U.S. stock market represented by the S&P 500 (SPX) declined 1.34%. U.S. interest rates represented by the U.S. government 30 – year yields (TYX) climbed .95%. A continuation of this trend during the next two weeks could trigger a mini crash for U.S. stocks.
The 10/15/23 blog “Catalyst for a Stock Market Panic” noted.
“It’s possible a continued rise in TYX could trigger declines in U.S. stocks.”
The daily SPX chart courtesy of BigCharts.com illustrates its action.
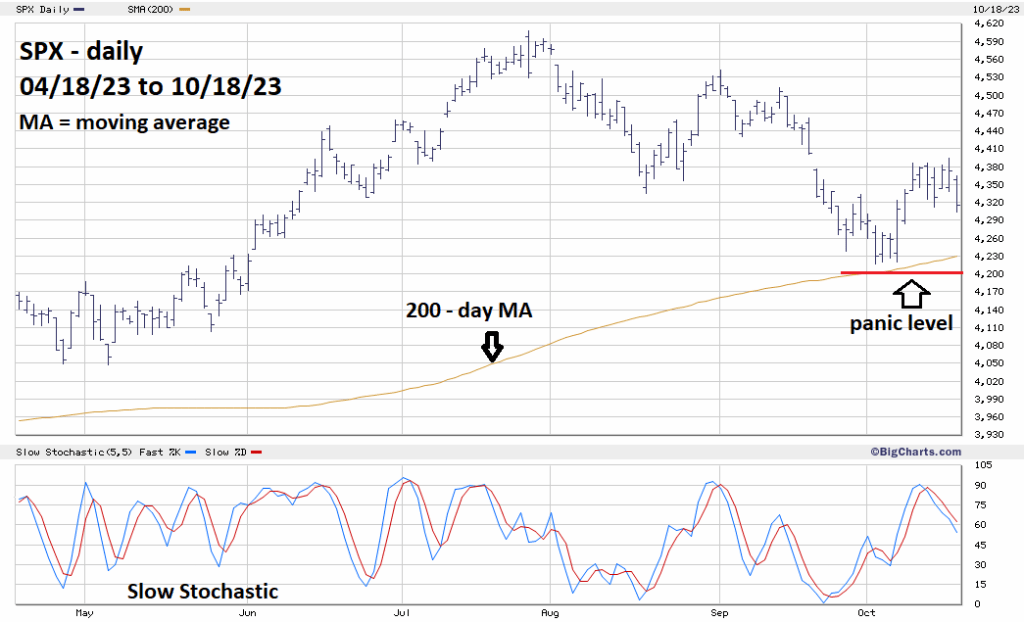
The decline on 10/18/23 reached the Fibonacci .50 retracement of the 10/03/23 to 10/17/23 rally. The much-watched SPX – 200 – day moving average (MA) has risen to 4,230. The 10/03/23 bottom is 4,216.45. A move below both these potential supports could trigger a selling panic. The potential panic level is now at about 4,200.
Daily Slow Stochastics is not near the oversold zone, which begins at 20%.
The daily TYX chart courtesy of Trading View shows its progress.

TYX is now close to moving above its 10/06/23 high labeled Minor wave “3” at 5.053. A move above the TYX 10/06/23 high would confirm that the presumed Minor wave “5” is developing. So far the 10 – year yields (TNX) and, 5 – year yields (FVX) have moved above their respective 10/06/23 tops and are making new 2023 highs.
Fibonacci resistance for TYX is at 5.665, which could be reached by late October or early November.
The next U.S. – FOMC decision on short-term interest rates is 11/01/23.
Watch TYX.
