The prior blog “S&P 500 – Rallies Deep into Resistance Zone – 10/11/23” noted.
(The sharp S&P 500 (SPX) rally could be nearing a top. Action on 10/12/23 could determine if it’s a top in a bear market rally or a signal to move higher.)
Today 10/12/23 the SPX moved marginally above the high made on 10/10/23 at 4,385.46. The SPX needs to move above 4,401.38 to erase the fear gap created on 09/21/23. Subsequent to the SPX high on 10/12/23 at 4,385.85 there was a sharp and relentless drop of 60 – points!
The dramatic reversal after topping in the fear resistance zone, strongly implies the rally from 10/06/23 bottom has terminated. U.S. stocks are vulnerable to decline during the remainder of the seasonally bearish month of October.
If there’s an October 2023 decline the SPX could take two paths.
The daily SPX chart courtesy of Trading View shows a potential shallow drop.

This Elliott wave count presumes an intermediate bottom may have been made on 10/03/23. In this wave count the subsequent drop could retrace about two – thirds of the October rally and not break below the 10/03/23 bottom. After a shallow drop the SPX could rally and move above the high made on 07/27/23.
The next daily SPX chart illustrates a very bearish Elliott wave count.
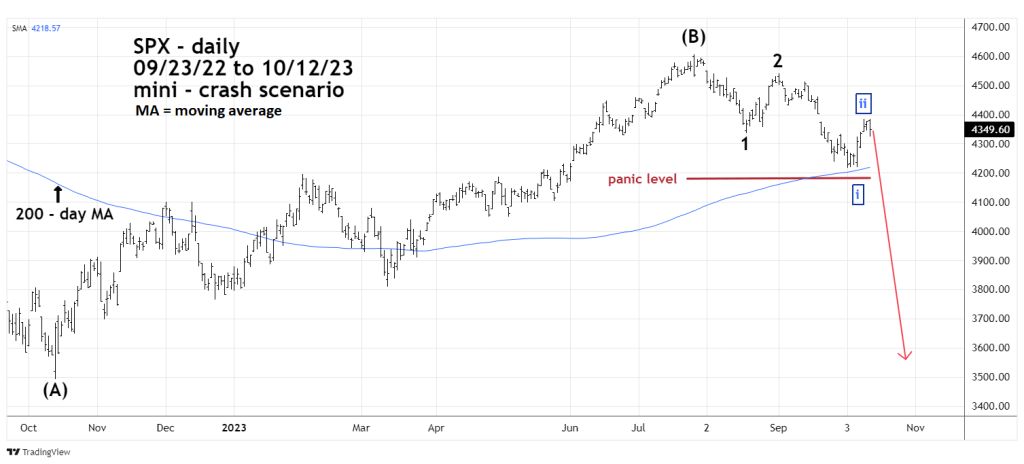
The dramatic bearish reversal on 10/12/23 increases the probabilities of a mini crash.
The important area to watch is the SPX – 200 – day moving average (MA). A decisive break below the 200 – day MA could trigger a panic among U.S. stock fund managers. The panic level could be near 4,175 to 4,180. If that level is broken, a 14 to 15% drop could occur in 1 to 5 trading days. A mini – crash bottom could be made sometime in late October 2023.
Traders on the opening of the SPX session at 9:30 AM – EDT – 10/13/23, short 50% non-leveraged SPX related funds. Use a move above 4,402.00 as a stop loss for half of the position. Use a move above 4,450.00 as a stop loss for the remainder of the position.

While my mid-term projection indicates a worrisome outlook for Q4 and anticipates further headwinds in the market until the end of the year, I am not yet fully convinced that the mini bullish phase has ended. Reflecting on the recent data, we observed that the market reached its maximum point on July 31. Subsequently, following a series of overbought readings, a notable point of inflection occurred on August 2. The market then spent four days in the oversold territory until August 17. However, the exit from this oversold position appeared rather weak, and any potential reversal on August 23 was quickly invalidated on August 24, signaling a continuation of the downtrend.
Subsequently, there were 11 consecutive days during which the SP500 remained in the oversold area, leading up to October 3. In contrast to the situation on August 23, this time the exit from the downtrend was fully confirmed. After this confirmation, the market briefly entered overbought area on October 11 and quickly bounced off it. However, it’s important to note that the SP500 this time did not spend a significant amount of time in the overbought area, and no reversal was confirmed.
Consequently, I intend to exercise caution and wait for a few more days before considering exiting my short position.
LikeLike
*correction… “before exiting my long position”
LikeLike
Thanks very much for the information.
The most important factor is time. More specficically, what time is it on the market clock.
October is seasonally bearish and November is the most bullish month. If there’s no sharp stock decline in October, there’s a good chance for a rally into at least late December 2023.
LikeLike
Correct, I get your point! Thank you a million times more. Your analyses are incredibly insightful, and I find them valuable and enjoyable to read. Unfortunately, I can only post textual comments here. However, if you would like, I can share graphical representations via email
LikeLike
Thanks for the compliment. I’m sending you an e-mail to you so you can send me graphical representations.
LikeLike
Thanks!
Sent!
LikeLike