Additional Evidence that the U.S. stock market could be forming an intermediate bottom.
Stock market turns can occur when a stock sector or sectors fail to confirm a new high or low of a market move. A broad example of this phenomenon is what I call a “Rule of the majority” signal. This signal happens when one of the three main U.S. stock indices; S&P 500 (SPX), Dow Jones Industrial Average (DJI), and Nasdaq Composite fails confirm a new high/low.
The daily SPX, DJI, and IXIC chart courtesy of Trading View illustrates the signal.

On 08/01/23 there was a bearish signal when the DJI made a new 2023 high unaccompanied by the SPX and IXIC.
On 10/06/23 there was a bullish signal when only the DJI was made a new post 08/01/23 decline low. This bullish signal would be invalidated if one or both of the other indices where to join the DJI in making new post 08/01/23 decline lows.
The next daily chart compares the SPX with the Put/Call ratio (PC).
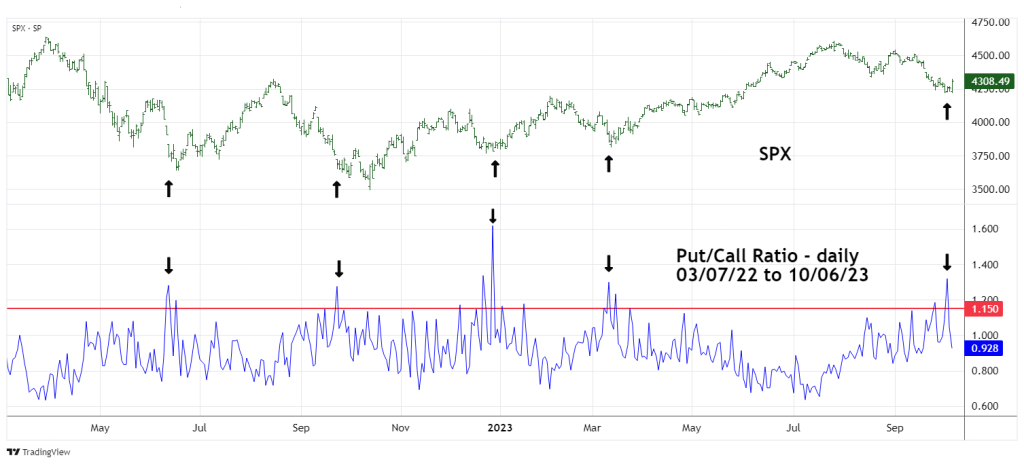
Note – the Put/Call ratio is not a Trading View Technical Indicator. PC can be accessed through the Symbol Search box.
“Investors Business Daily” uses PC moves above the 1.15 level as a signal for potential U.S. stock market bottoms.
Since June of 2022 there have been four effective PC spike signals that have occurred at or near SPX bottoms. The most recent signal happened on 10/04/23 one day after the SPX July to October low.
The next daily chart compares the SPX to the SPX – Volatility Index (VIX).

On 10/04/23 the VIX hit a high of 20.88. Normally SPX bottoms occur with VIX readings of at least 30.00. A reading of 20.88 is not the type of signal to expect at a significant SPX bottom. However, there was an interesting VIX signal made on 09/15/23.
The vast majority of the time, the SPX makes a significant peak while the VIX is making a higher low. On 06/22/23 the VIX made a new low of 12.73. Then on 07/27/23 when the SPX was making its 2023 high, VIX made a higher low at 12.74.
The diverging VIX bottom was broken on 09/15/23 as the VIX fell to a new 2023 low of 12.68.
Perhaps the relatively shallow VIX move up to 20.88 is just a bounce in a larger VIX downtrend that could take it to the 11.00 or 10.00 level? A lower trending VIX is bullish for the SPX. If the VIX can reach 11.00 in a few months, maybe the SPX could correspondingly make a new 2023 high.
The evidence that U.S, stocks are forming a bottom is moderate. There’s still plenty of time left in the seasonally bearish month of October.
The action U.S. stocks make on 10/09/23 could be important.
