The 09/30/23 blog “S&P 500 – Nearing Support – 09/29/23” noted.
(The presumed pattern from the 09/01/23 high could be complete on 10/02/23 or 10/03/23 in the area of 4,225 to 4,175.)
On 10/03/23 the S&P 500 (SPX) low was 4,216.45.
The daily SPX chart courtesy of Trading View updates the action.
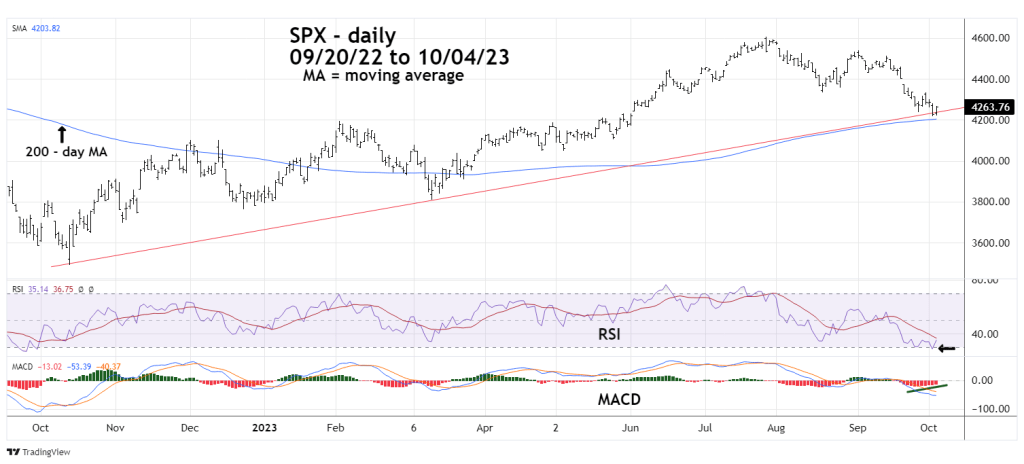
Daily RSI on 10/03/23 was 28.66. The oversold zone starts at 30%.
MACD – Histogram had a bullish divergence.
The intraday SPX – Elliott wave count has some doubt. It appears the presumed Minute wave “v” may have terminated on 10/04/23 with a truncated Minuette wave (v).
This doubt opens the possibility for a break below 4,216.45 on 10/05/23.
A detailed Elliott wave analysis blog will be posted after the 10/05/23 SPX session.
