Significant bearish divergence between Crude Oil and Energy stocks indicates a multi-month Crude Oil drop may have begun.
On 09/28/23 the Crude Oil Continuous futures (CL2!) reached the highest point of is 2023 bull run. The CL2! – top was unconfirmed by the Energy stock – Exchange Traded Fund (XLE).
The daily CL2! – and XLE chart courtesy of Trading View illustrates their relationship.
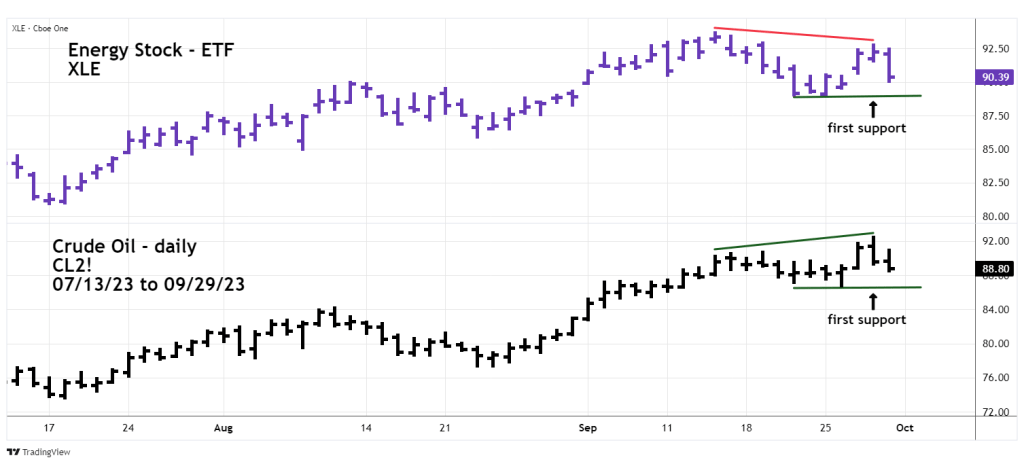
For more than two – months both Crude Oil and Energy stock trended closely together. However, XLE peaked on 09/14/23 while CL2! – continued climbing into 09/28/23, then dropped 4.6%.
The first Crude Oil support level is 86.74 made on 09/26/23. A break of this bottom could trigger a rapid decline to the next support zone in the low 77.00 to 78.00 area.
The first support for XLE is 89.01 made on 09/21/23. If the XLE continues to decline, it could add fuel to the current bear move in U.S. stocks.
The daily CL2! – chart shows the effectiveness of the lunar cycle on the Crude Oil market.

Many markets can occasionally have turns plus or minus two trading days of New/Full Moons. So far within the prior 15 – months there have been 11 – effective lunar turn signals. The CL2! – top on 09/28/23 was one trading day before a full moon. If the 09/29/23 lunar cycle is effective it implies at least a decline of 2 or 3 -weeks.
Broader seasonal patterns for Crude Oil are bearish from late August until late December.
Broader seasonal patterns for stocks are bearish from late August until late October.
This implies stocks making a significant bottom in October, while Crude Oil continues to decline. If so, going into late 2023 – XLE could be the weakest sector.
