The 09/23/23 blog “Possible Major S&P 500 – Bottom October 2023” noted that on 09/22/23 the S&P 500 (SPX) broke below the low end of a double bottom at 4,328.08. The blog illustrated the next support could be in the upper 4,100 to low 4,200 area.
The daily SPX chart courtesy of Trading View updates the action.

The three potential support factors are a rising trendline connecting the October 2022 and March 2023 bottoms, the 200 – day moving average (MA), and the .382 Fibonacci retracement of the SPX October to July rally.
A move below the trendline is likely to bring in more selling that could push the SPX down to the Fibonacci retracement level and the 200 – day MA. Most if not all U.S. stock fund managers measure their performance vs. the SPX. The widely watched – 200 – day MA is a logical point where buying could occur.
The next daily SPX chart shows a potential developing Elliott wave count.
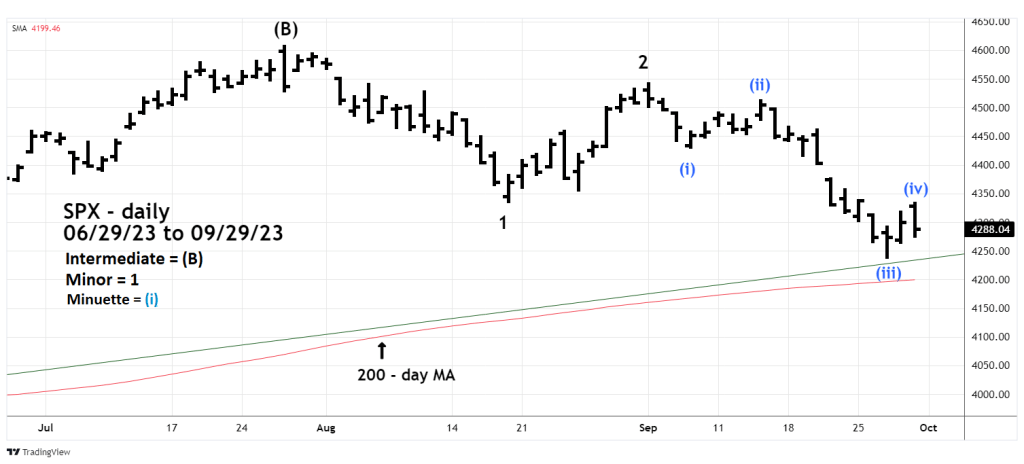
During the first minute of the 09/29/23 SPX trading session it reached 4,333.15 – the high of the day.
The two coordinates of the SPX double bottom broken on 09/22/23 were 4,328.08 and 4,335.31. The 09/29/23 SPX high at 4,333.15 was in the zone of prior support. Frequently former support can become resistance.
The move down from the high on 09/01/23 labeled Minor wave “2” appears to be a developing Elliott – Impulse wave. If so the move down from the 09/29/23 high could be Minuette wave (v) of a developing Minute wave “i”.
The presumed pattern from the 09/01/23 high could be complete on 10/02/23 or 10/03/23 in the area of 4,225 to 4,175.
