The 09/17/23 blog “Crude Oil Elliott Wave Pattern 09/15/23” noted that Crude Oil – Continuous Futures (CL2!) could make a significant top in the 91.50 to 94.80 zone. On 09/27/23 – CL2! – entered the topping zone.
The daily CL2! – chart courtesy of Trading View updates the action.
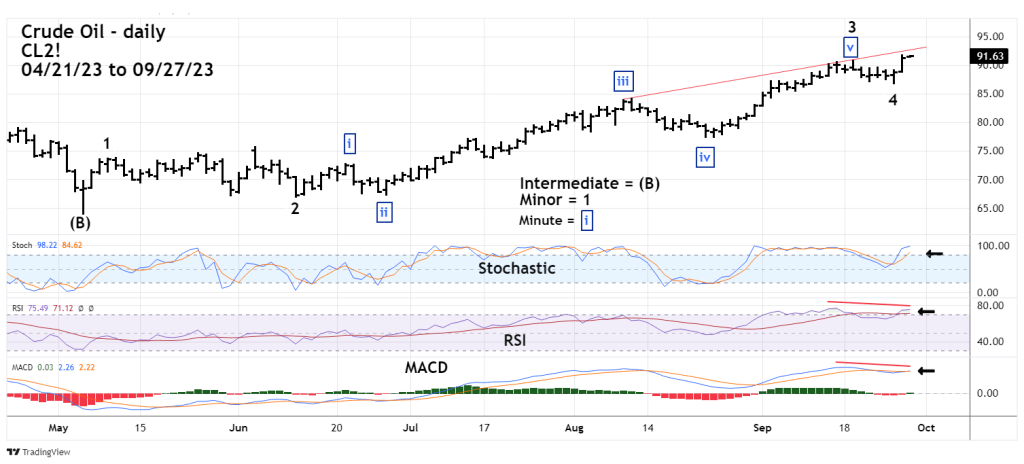
It now appears that the peak made on 09/19/23 at 90.75 was the termination point of an extended Minor wave “3”. The move today above 90.75 strongly implies Minor wave “5” could be developing.
Daily Stochastic lines are wide implying more upside action.
Both RSI and MACD have bearish divergences.
The 09/17/23 blog noted Fibonacci analysis pointed to a bullseye top at 94.31. The rising trendline connecting the tops of 08/10/23 and 09/19/23 will be in the 92.00 area on 09/28/23 and 09/29/23.
The one – hour Crude Oil chart illustrates the short – term Elliott wave pattern.
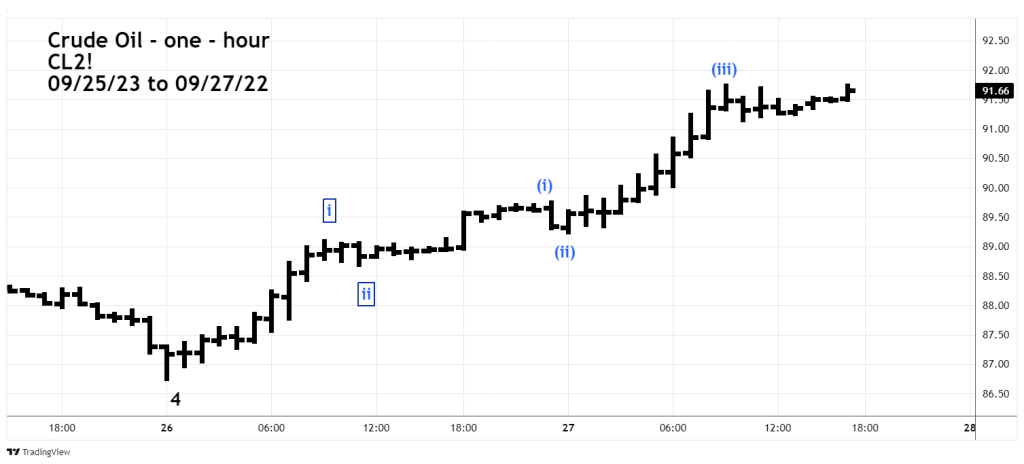
The presumed Minor wave “5” appears to be a developing extended Elliott wave Impulse pattern which could complete on either 09/28/23 or 09/29/23.
There’s a Full Moon on 09/29/23. Commodities tend to peak on Full Moons.
