The 09/17/23 blog “Crude Oil Elliott Wave Pattern – 09/15/23” noted that an important Crude Oil top could occur in a few trading days. Recent action of the Energy sector exchange traded fund (XLE) indicates they may have topped on 09/14/23.
Since the S&P 500 (SPX) all-time high in January 2022, both the XLE and the Technology sector exchange traded fund (XLK) have outperformed the SPX.
The weekly SPX, XLE, and XLK chart courtesy of Trading View illustrates their relationship.
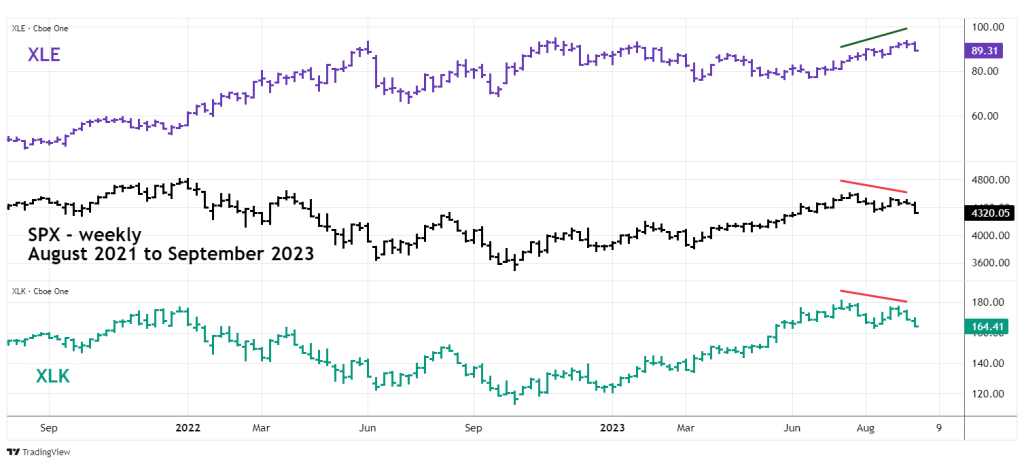
XLE and XLK have been more bullish than the SPX and have been the leading sectors in the post March 2023 bull run.
During the last several weeks XLE, as a result of rising Crude Oil has outperformed SPX and XLK.
After 09/14/23 XLE joined the downturn in U.S. stocks.
The daily XLE chart compares it to the Crude Oil continuous futures chart (CL2!)

On 09/21/23 XLE had reached the level it was at on 08/31/23 while CL2! – Crude Oil was at a significantly higher level. The XLE deeper decline has bearish implications for Crude Oil and the broader U.S. stock market.
Note that XLE highest point was made on 09/14/23, Crude Oils high point so far was on 09/19/23. The bearish divergence hints that perhaps Crude Oils bull market has ended. Watch CL2! – Crude Oil – 09/25/23 to 09/29/23. If it exceeds the 09/19/23 high with another XLE bearish divergence it could be an important top.
If XLE has made a significant top, its decline will likely add fuel to a probable developing bear market in U.S. stocks.
