The 09/09/23 blog “U.S. Interest Rates Ready to Thrust Higher” noted that long – term U.S. interest rates/yields could soon make new highs. Also noted, (The most important point on the chart is the 08/21/23 peak at 4.474 which is labeled Minor wave “1”.)
Today 09/21/23 U.S. 30 – year treasury yields (TYX) blasted above 4.474.
The daily TYX chart courtesy of Trading View shows the short – term action.
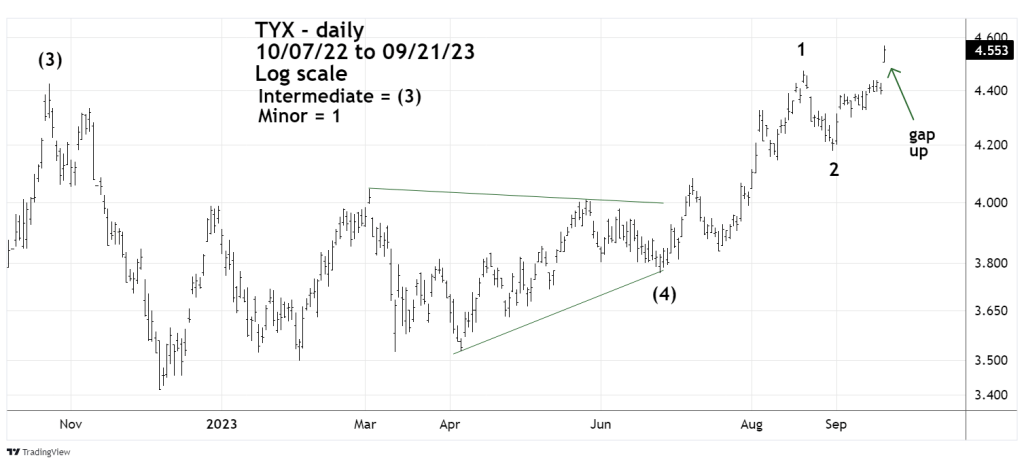
Assuming the giant move up on 09/21/23 is not a blow – off top, TYX could continue climbing into mid or late October 2023. From an Elliott wave perspective TYX is probably in the middle of Minor wave “3” of Intermediate wave “5”. Third waves are usually the most dynamic impulse wave and the middle part of third waves are typically very strong.
The weekly TYX chart examines its progress from the March 2020 bottom.

When measuring markets or stocks that have had large percentage gains, its more appropriate to measure growth rates instead of points.
TYX has moved up from March 2020 in a clear Elliott – Impulse wave. Within Impulse waves there’s usually a Fibonacci relationship between sub waves “one” and “five” of the Impulse pattern.
The growth rate of Intermediate wave (1) was colossal, and typical of a kick – off wave. In this case the “kick- off” could be the start of a multi – year move up.
Because of the large wave (1) growth rate, it’s unlikely wave (5) could equal wave (1). The rising trendline connecting the tops of wave (1) and (3) gives us a rough guide to where Intermediate wave (5) could peak.
The presumed wave (4) appears to be an Elliott wave – Horizontal Triangle. In this pattern the calculation for the fifth wave begins at the Horizontal Triangle termination point. In this case it’s the bottom made on 06/26/23 at 3.769.
The growth rate of wave (1) was 1.317 multiplied by the Fibonacci ratio of .382 equals .503.
Adding a growth rate of .503 to the wave (4) bottom of 3.769 targets 5.665 which is near the rising trendline. The broad target zone is 5.50 to 6.00 which could be reached sometime in October 2023.
Also note the big TYX move up on 09/21/23 corresponded with a large move down in U.S. stocks. This phenomenon has been occurring for several weeks and could continue into October 2023.
