The Nasdaq Composite (IXIC) declined from 07/19/23 to 08/18/23. On 08/30/23 the IXIC and the other two main U.S. stock indices may have made tops in a developing bear trend.
The 08/26/23 blog “Nasdaq Composite Elliott Wave Count – 08/25/23” illustrated a potential resistance zone from 13,900 to 13,980.
The IXIC – two-hour chart courtesy of Trading View shows what happened.

The IXIC 08/30/23 high was 14,050 exceeding the Fibonacci .618 retracement of the 07/19/23 to 08/18/23 decline. However, the top was very close to where a presumed wave “a” is equal to a presumed wave “c”. This is a common Fibonacci relationship in Elliott wave – Zigzag corrections.
The daily Apple Inc. (AAPL) chart illustrates its Elliott wave count from its 2023 high.
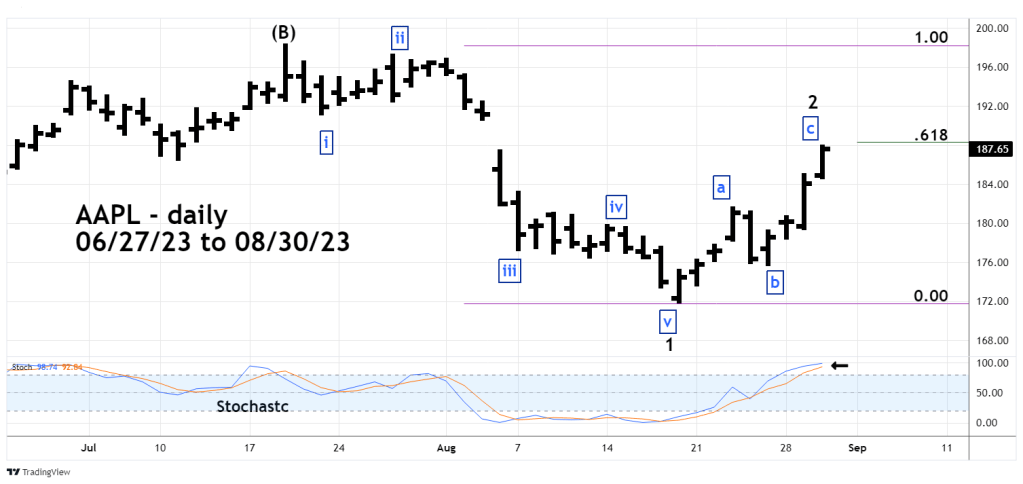
The 08/27/23 blog noted a resistance zone of 185 to 189 and further stated “If AAPL reaches the broad resistance zone with daily Stochastic in the overbought zone it could signal a counter trend peak.”
Daily Stochastic has reached the overbought zone above 80% and the AAPL 08/30/23 high was 187.85, just below a Fibonacci .618 retracement of its 07/19/23 to 08/18/23 decline.
September to October is seasonally bearish for stocks.
Sometimes markets will turn plus or minus two trading days from New/Full moons. 08/31/23 is a Full moon.
