Sometimes individual stocks can have amazingly clear and accurate Elliott wave patterns. The recent action of Apple Inc. (AAPL) could be very helpful in timing the broader U.S. stock market.
The two – hour APPL chart courtesy of Trading View illustrates its Elliott wave pattern since 07/19/23.
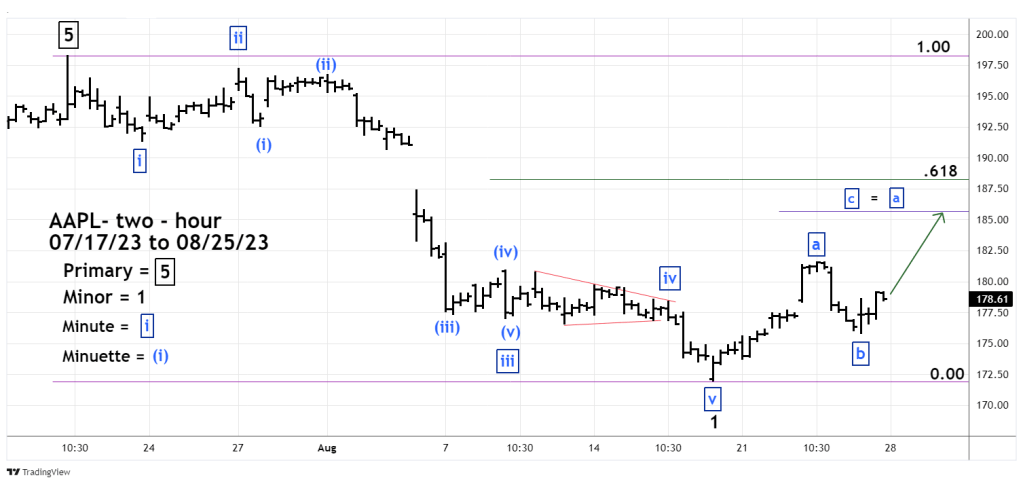
From 07/19/23 to 08/18/23 APPL formed a clear five – wave Elliott Impulse pattern. Two distinct features of the formation are the extended Impulse pattern of Minute wave “iii” – boxed and the Horizontal Triangle of Minute wave “iv”.
The movement after the 08/18/23 bottom is similar to the Nasdaq Composite pattern which was illustrated in this sites prior blog. If the wave count is correct AAPL could be in Minute wave “c” of Minor wave “2”.
There are two possible termination points for Minor wave “2”. The first is where Minute wave “c” will equal Minute wave “a”. The second is a Fibonacci .618 retracement of the 07/19/23 to 08/18/23 decline. The broad target zone is 185 to 189.
The daily AAPL chart shows its momentum.

Stochastics is a fast-moving oscillator and can be very effective in identifying counter trend tops/bottoms. Daily Stochastic is approaching the overbought zone which begins at 80%.
If AAPL reaches the broad resistance zone with daily Stochastic in the overbought zone it could signal a counter trend peak.
