Today 8/16/23 the S&P 500 (SPX) made a new decline low. Fibonacci analysis provides clues to potential short-term support levels.
The 08/15/23 blog illustrated that the SPX was in a declining wedge. The 2- hour SPX chart courtesy of Trading View shows what happened to the wedge.
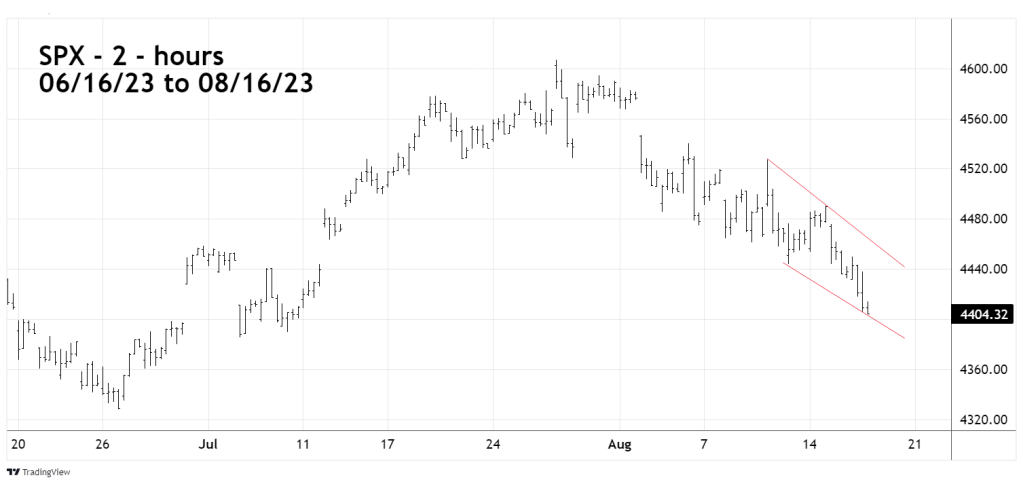
The wedge is gone, and the SPX is now in a near perfect parallel channel. It’s highly unlikely that an Elliott wave Ending Diagonal Triangle is forming. This action increases the chances for lower SPX prices.
The daily SPX chart illustrates two downside targets.

Note that at the SPX 08/16/23 close, daily RSI was 38%. The oversold zone begins at 30%. Its possible RSI could go below 30% and then have at least one bullish divergence.
A Fibonacci .236 retrace of October 2022 to July rally is near SPX 4350. The SPX closed 08/16/23 at 4404 and could reach 4350 on 08/17/23.
If there’s at least a short-term bottom the Fibonacci .382 retrace level is the more likely bottom target and could be reached in a few trading days.
Seasonal stock market patterns and longer-term momentum evidence implies the SPX could reach the price area of the October 2022 bottom sometime in October 2023.
