Growing evidence indicates U.S stocks could be in a multi-week decline.
The S&P 500 (SPX) 30 – minute chart courtesy of Trading View illustrates the short-term view.

Early in the 08/04/23 SPX session stocks rallied on bullish economic news. In a bullish trend the rally would likely continue until the end of the session or at least hold the bulk of the gains.
What happened was not only a complete retracement of the day’s gains, but it also moved below the bottom made on 08/03/23. This is the second time important short-term support has been broken. The first was a break below the 07/27/23 key reversal bottom. Now a break below a possible Elliott – three wave correction bottom.
There could be support at the Fibonacci .618 retracement of the July rally. This level is also near chart support. Below this potential support zone there’s open air down to the early July bottom.
The daily SPX chart examines the intermediate view.

The strongest evidence for a continuing decline comes from the decisive break below the rising trendline from the 05/24/23 bottom.
Daily MACD has a bearish lines cross and Is trending down. RSI has yet to reach the oversold zone which starts at 30%. Note that RSI is now below the reading it made on 06/26/23. RSI moves above/below prior readings can sometimes predict price movements. In this case its predicted the SPX could soon be going to the 06/26/23 bottom at 4,328.08.
Both Stochastic lines have reached the oversold zone. Stochastic is the fastest moving of the three oscillator’s illustrated on this chart. Its possible it could remain oversold for several trading days. Note that Stochastic was in the overbought zone for most of July.
The weekly SPX chart illustrates longer – term momentum and price evidence.
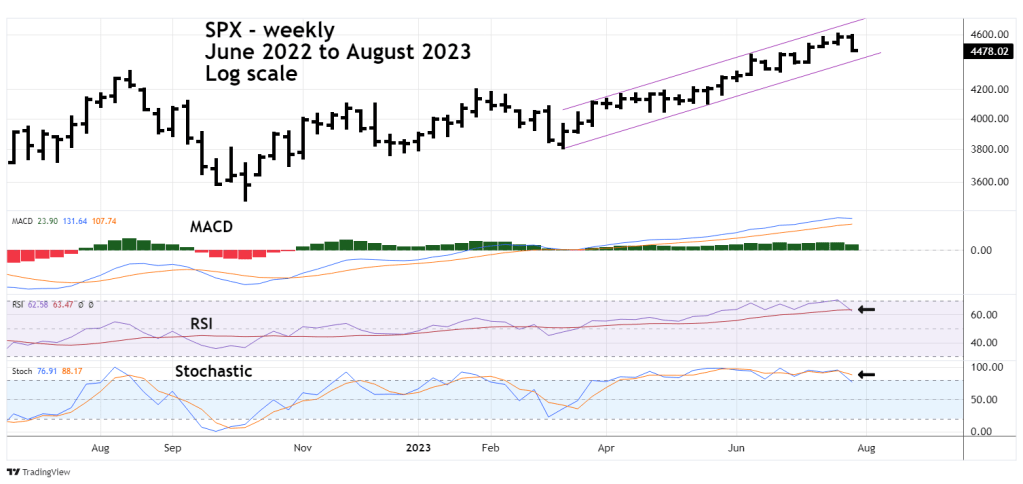
The parallel trend channel was drawn from the Trading View tools and is perfect on a Log scale chart. Note that the lower trendline crosses near the area of the early July bottom – around 4,385 to 4,410. This could be at least a short- term support zone.
Weekly MACD has no bearish signs. Weekly RSI has crossed below its moving average line. Stochastic has a bearish lines crossover.
The 2023 edition of “Stock Trader’s Almanac” notes that for the last 30- years a down Friday followed by a down Monday has frequently corresponded with important market inflection points. In the current situation it implies a top.
There could be additional bearish evidence If Monday 08/07/23 is a down day for U.S stocks.
