The 07/27/23 blog “Rising Long-Term Interest Rates – 07/27/23” illustrated a bullish Elliott wave count forecasting a move in U.S 30-year Treasury yields (TYX) above the October 2022 peak. Point & Figure chart analysis identifies potential resistance points on the upside path.
Markets are battlefields between bullish and bearish forces. Point & Figure charts provide very effective battlefield maps because they can clearly illustrate the strength/weakness of the opposing forces.
The 30 – minute TYX – Point & Figure chart courtesy of Trading View illustrates the battlefield since September 2022.
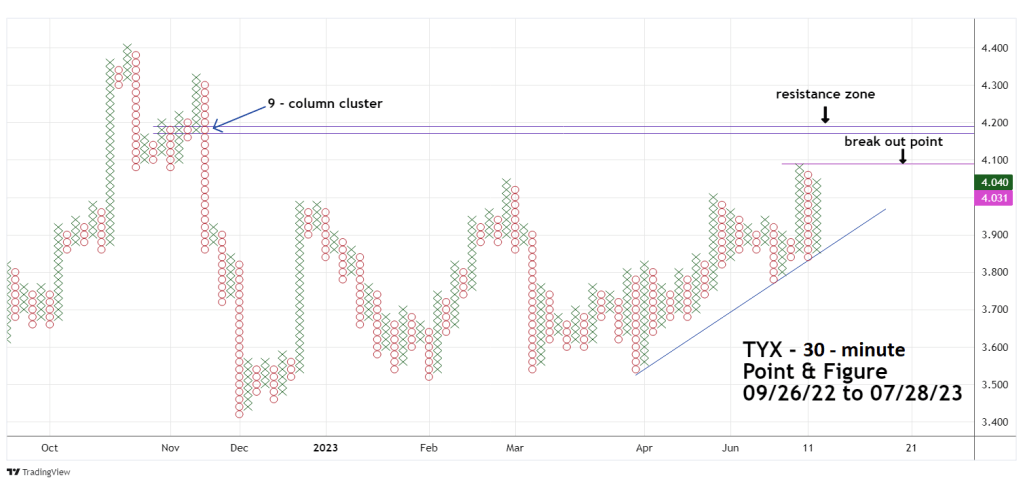
The first obstacle the bulls need to overcome is the high made on 07/10/23 at TYX 4.085. If the 07/10/23 high is exceeded there are no other resistance points until the 4.17 level. Note the one column decline in November 2022, the bulls could easily push through this zone.
From 4.17 to 4.19 is a six column, one row resistance zone. The width of columns and height of the rows determines the strength of potential support/resistance. The six columns could delay the bulls, but the one row implies a relatively quick breakthrough.
A move above 4.19 could open the door for a move to the area around the October 2022 top.
Also note the rising trendline from April 2023. A break below the trendline could indicate a developing bearish trend.
The 5 – minute TYX chart shows the short-term view.
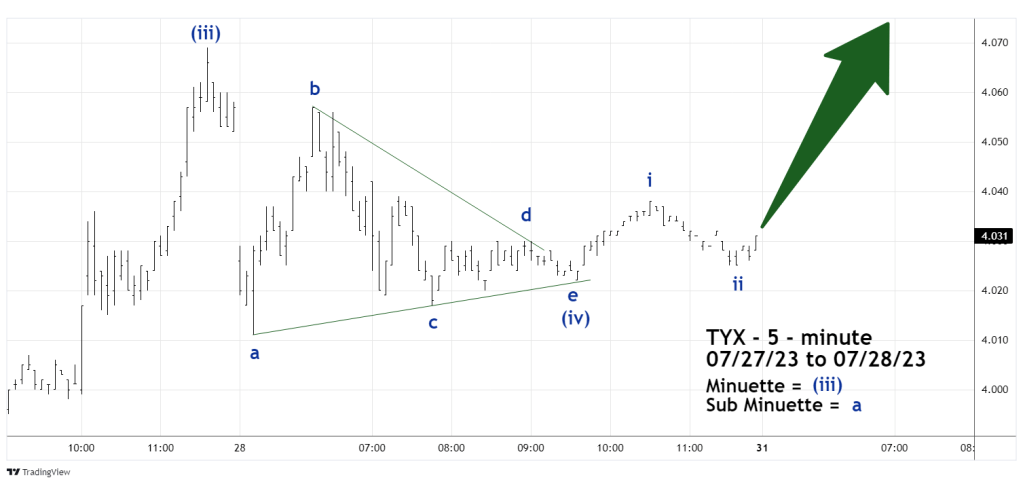
The 07/27/23 blog illustrated that on the daily scale TYX may have completed an Elliott wave Horizontal Triangle and was in the early phase of a rising impulse wave.
The very same pattern appears to be present on the 5 – minute scale. If the count is correct TYX could be poised for a strong rally.
On 07/27/23 and 07/28/23 when TYX moved up, U.S. stocks went down. This phenomenon could continue on 07/31/23.
