Stock market momentum can be measured two ways, externally or internally. Momentum oscillators such as RSI and Stochastic are external indicators. Internal momentum examines what’s happening under the surface of price – Advance/Decline lines and new highs/lows. This blogs looks at two internal indicators for the U.S. stock market. 52 – week highs and the S&P 500 Bullish Percent index.
The daily NYSE 52 – week highs chart ($MAHN) courtesy of Barchart.com illustrates its trend.

The S&P 500 (SPX) 2023 high on 07/27/23 had a significant bearish divergence vs. the momentum peak recorded on 06/30/23.
The next chart courtesy of StockCharts.com shows the S&P 500 – Bullish Percent Index ($BPSPX).
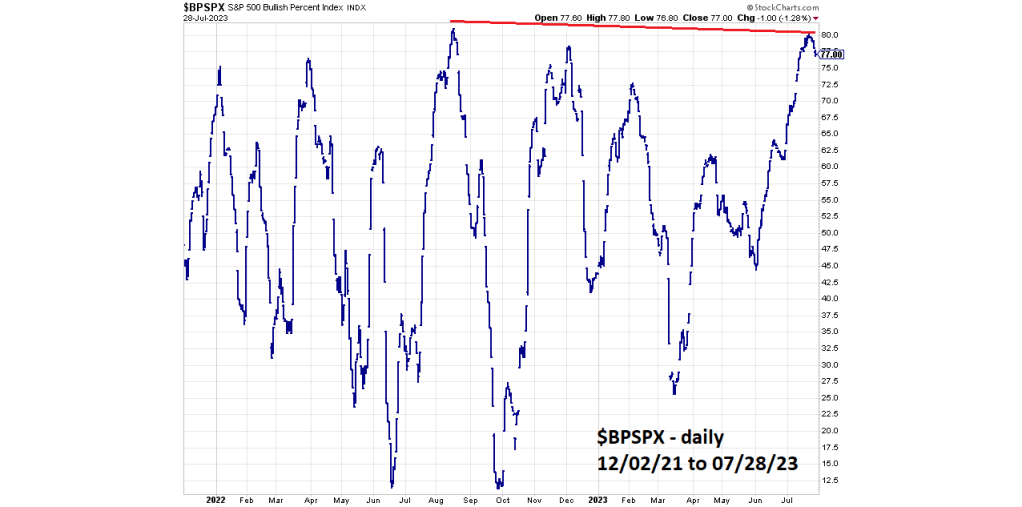
The Bullish Percent Index is a breadth indicator that shows the percentage of stocks on Point & Figure buy signals.
The 06/18/23 blog “S&P 500 Topping Zones” noted that the $BPSPX reading at the August 2022 SPX top was not normal because there was no bearish divergence. The recent $BPSPX July 2023 readings diverged against the August 2022 reading. The SPX in July 2023 traded in the 4,500 to 4,600 area vs. the 4,200 to 4,300 area in August 2022.
The next daily $BPSPX chart is illustrated in conjunction with RSI.

The 06/18/23 blog noted that RSI on a $BPSPX chart could identify potential SPX topping zones. From 06/30/23 to 07/27/23 the $BPSPX – RSI was above 70% – the overbought zone. On 07/28/23 the RSI moved below the overbought zone implying at least a short- term decline has begun.
On 07/27/23 the SPX had a very sharp “Key Reversal Day” On 07/28/23 the bulls launched a robust counterattack. An SPX move below the 07/27/23 bottom could trigger at least a multi-day decline.

Good stuff as usual!
In mid-June, I found myself perplexed by the unfolding events in the financial markets. Despite several signals pointing towards an imminent short-term correction, the market defied expectations and continued its upward trajectory for the last two quarters. This enigmatic scenario led me to explore potential explanations, including the impact of portfolio rebalancing and the influence of diverse market strategies.
Could June be the month where portfolios were rebalanced? It seemed likely. Portfolio rebalancing is a common practice among investors to maintain their desired asset allocations. The influx of capital resulting from selling overperforming assets and buying underperforming ones could have been substantial enough to offset the correction signals and keep the market afloat.
Another intriguing factor was the diverse strategies adopted by different market players. Perhaps each player, from market makers to asset managers and leveraged investors, brought their unique approach to investing, shaped by their risk appetite and perspective. Some investors may have chosen to hold onto their positions, while others opted for profit-taking. This diversity in strategies could have neutralized the impact of correction signals and contributed to the market’s upward momentum.
Looking ahead, the lingering question was the potential intensity of any future corrections. The prolonged upward trend may have created excesses in the market, increasing the possibility of a sharper correction when it occurs. As an investor, I couldn’t overlook this potential risk and needed to stay vigilant.
Would be very interested to hear your thoughts.
LikeLiked by 1 person
Thanks very much for your comments. Its possible portfolio rebalancing in June may be a reason for the rally. In a broader context the activity in U.S. stocks during the prior three to four weeks is manic buying which occurs late in a bull market or late in a bear market rally.
Fundamental and Technical evidence is ignored, and the buying is triggered simply because the trend is recognized as up. This is how you get a thirteen-day winning streak in the Dow Jones Industrial Average- which hasn’t happened for thirty-six years!
There’s a high probability that if the rally from October 2022 is complete, it could be followed by a rapid drop. Nine months of upside progress could be wiped out in two or three months.
LikeLike