The U.S. stock market is currently experiencing a mania fueled mostly by the Technology stock sector. The main stock indices continue to move higher in spite of bearish momentum and sentiment divergences. The current mania is a pale shadow of the major Technology stock mania from late 1999 to early 2000.
The daily Nasdaq 100 chart (NDQ) courtesy of Trading View illustrates what happened after the major mania 1999 to 2000.
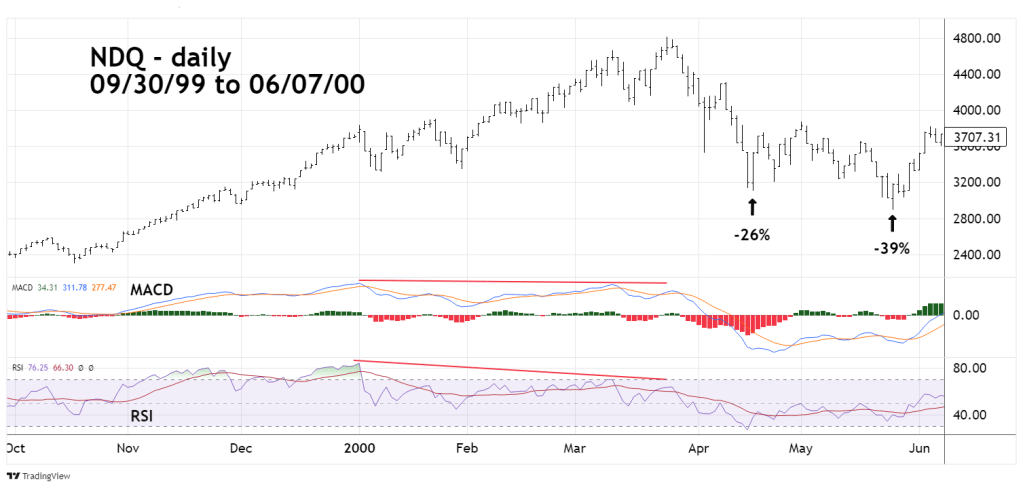
The NDQ had a high percentage of Technology stocks. The rally continued in spite of bearish momentum divergence. When the rally ended the exuberant stock bulls were shocked. Within two weeks NDQ had declined 26%. In two months NDQ was down 39%. Two years after the NDQ – 2000 top it was down more than 80%!
Manias can end suddenly.
Traders were short 100% of non- leveraged SPX related funds from the SPX open on 07/05/23 with a stop loss on half the position on an SPX move above 4,550.00. The percentage move from the 07/05/23 open to 4,550.00 is 2.4% a 1.2% loss on half of the position. Continue holding short on the remaining position with a stop loss on an SPX move above 4,650.00.

AI furled mania, similar to 1999 dawn of internet age crash. Probably not going to end well.
LikeLike
Thanks for the comment.
LikeLike