The German Stock Index (DEU40) appears to be in the early phase of a significant bear move.
The daily DEU40 chart courtesy of Trading View illustrates the action.
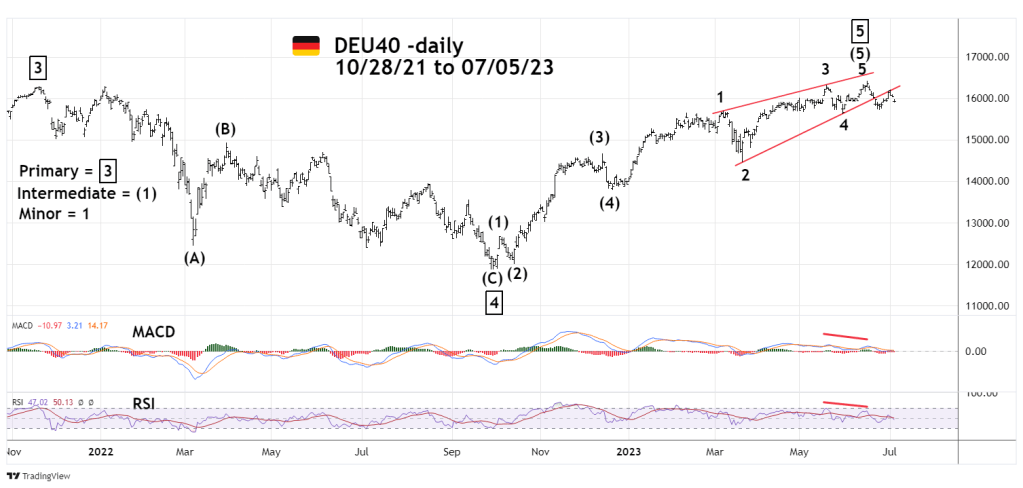
In mid – June 2023 the DEU40 made a new all-time high. The pattern up from September 2022 bottom counts as an Elliott – five wave Impulse. The movement from December 2022 labeled as Intermediate wave (5) is an Elliott wave – Ending Diagonal Triangle. These are termination patterns of the larger trend. Note the recent break below the rising lower trendline. The subsequent rally back to the trendline, then reversing is a classic example of prior support becoming resistance.
Bearish divergence on the daily RSI and MACD support the theory that a bear phase has begun. If so, within one or two weeks the DEU40 could reach the 14,500 area – first support.
The bearish evidence from DEU40 is another indication of a possible global stock bear market.
