On 05/26/23 the Nasdaq Composite (IXIC) was the only one of the three main U.S. stock indices to make a new post October 2022 rally high. The S&P 500 (SPX) 05/26/23 high was 4,212.87, its 05/19/23 post October 2023 rally high was 4,212.91 a difference of only 4 – ticks! This is an example of the Fibonacci relationship of equality. The Dow Jones Industrial Average (DJI) post October 2022 rally high was made 12/13/22. On 05/26/23 it didn’t even come close to its 05/19/23 high.
This bearish divergence among the three main U.S. stock indices only tells part of the story. Looking underneath the surface of the IXIC and in particular, its sub index the Nasdaq 100 – Trading View symbol (NDQ) reveals some shockingly bearish evidence.
The daily NDQ chart courtesy of Trading View illustrates its action since its all-time high in November 2021.

The Nasdaq-100 is a stock market index made up of 101 equity securities issued by 100 of the largest non-financial companies listed on the Nasdaq stock exchange.
Note that on 05/26/23 the NDQ was very close to a .618 Fibonacci retracement of its November 2021 to October 2022 decline. The exact .618 level is 14,349.00 the NDQ high on 05/26/23 was 14,329.49 a difference of 19.51 points or .0013.
Daily MACD has a bearish divergence. Daily RSI is in the overbought zone above 70% with no bearish divergence.
NDQ has rallied 5.9%. from its 05/24/23 bottom.
The next chart courtesy of Barchart.com shows the Nasdaq Composite 52 – week highs ($MAHQ).
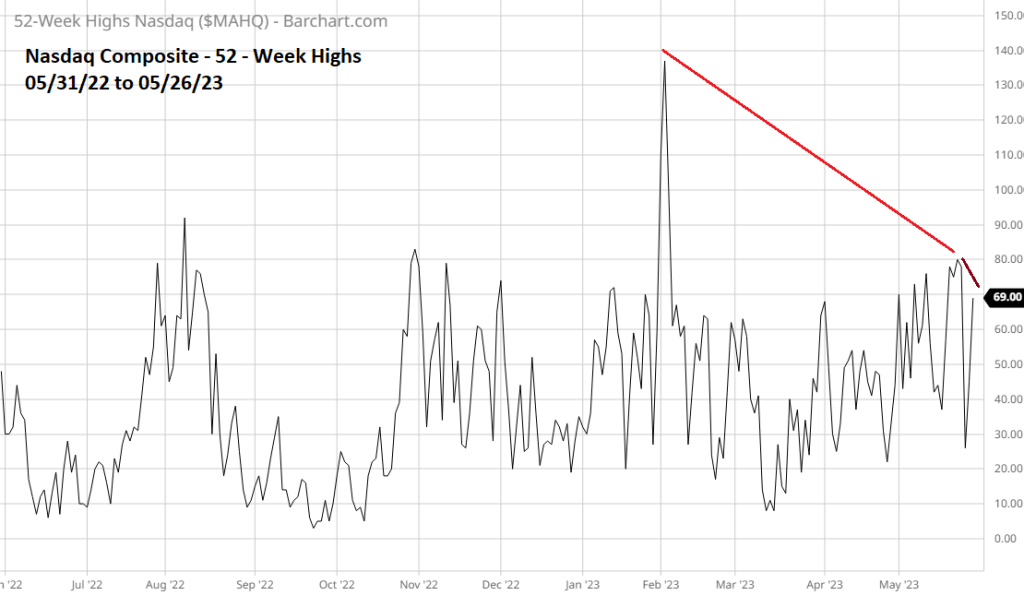
On 05/22/23 the IXIC made a new post October 2022 rally high with a significant $MAHQ bearish divergence. On 05/26/23 the IXIC was almost 2% above its 05/22/23 high with the %MAHQ 13% below its 05/22/23 reading.
The next chart courtesy of StockCharts.com illustrates the Nasdaq 100 – Bullish Percent Index ($BPNDX).

The Bullish Percent Index, is a breadth indicator that shows the percentage of stocks on Point & Figure Buy Signals.
Typically, a Bullish Percent Index could have several bearish divergence before price makes its final top. In this case $BPNDX had a bearish divergence in early February vs. the December peak. Then on 05/22/23 there was another bearish divergence vs. the February top.
Now look closely at what happened on 05/26/23. Not only is there another bearish divergence, but $BPNDX has barely moved above its 05/24/22 bottom! The Nasdaq 100 moves up 5.9% from its 05/24/22 bottom with a gigantic bearish divergence – this is outrageous!
On 05/26/23 only one of the three main U.S. stock indices was able to make a new post October 2022 rally high. The strongest of the three main indices had 52 – week highs making a double bearish divergence. The Nasdaq 100 is stronger than Nasdaq Composite and has rallied to just below a .618 retracement of its prior bear phase – with multiple $BPNDX bearish divergences.
Underneath the facade of the U.S. stock indices is a rotting structure that could soon come tumbling down.

That powerful rally on Friday with light volume is very suspect
LikeLiked by 1 person
That right.
LikeLike
Most states have the strongest jobs numbers on record. Therefore the Fed will likely continue to hike rates. Higher rates will make fund managers rebalance out of equities. We may have a long deleveraging period for equites. My question is does you analysis point to a drastic sudden drop or more a slower downtrend?
LikeLike
Excellent observations. I have been watching both BPSPX and BPNDX like a hawk lately. Many thanks.
LikeLike
Happy I can help.
LikeLike
Most states have the strongest jobs numbers on record. Therefore the Fed will likely continue to hike rates. Higher rates will make fund managers rebalance out of equities. We may have a long deleveraging period for equites. My question is does you analysis point to a drastic sudden drop or more a slower downtrend?
LikeLike
Hi
That’s a great question. It is generally harder to predict the speed of a trend. Sometimes Point & Figure analysis and the Elliott wave method can spot points where an acceleration in the trend could begin. Currently there is no evidence of a sudden drop. If stocks go down there could be a sudden drop weeks or months later. Please look at an SPX chart from October 2007 to December 2008. There was a sudden drop, but it did not happen until September – October 2008.
LikeLike