The 04/20/23 Blog “The Next S&P 500 Support Level” noted the S&P 500 (SPX) had Fibonacci support at 4,107.06 and 4,108.06. Also noted, “When you have two Fibonacci coordinates that are very close together it represents powerful support/resistance. A break trough of powerful support/resistance would require powerful force.”
On 04/21/23 the SPX bottomed out at 4,113.86. Today 04/25/23 the SPX blasted below the Fibonacci support level and ended the session down 65.41 points.
The daily SPX chart courtesy of BigCharts.com updates the action.
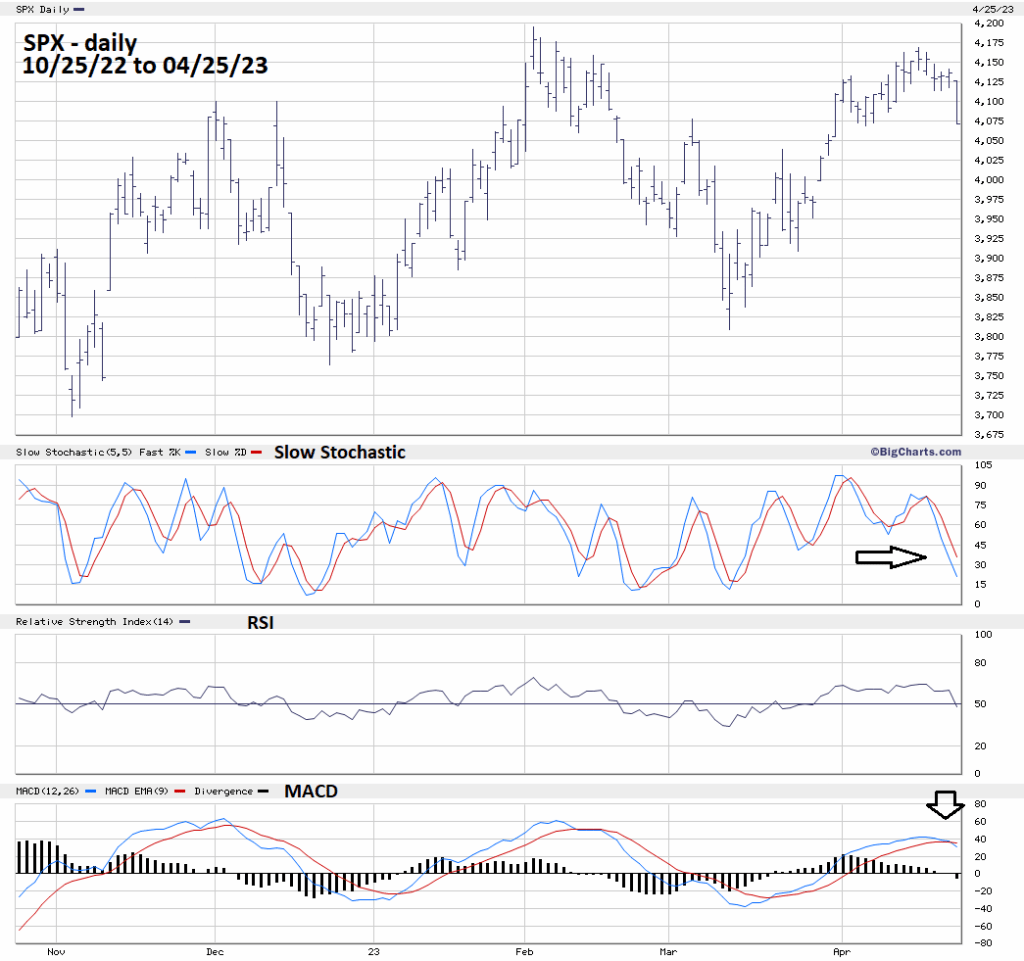
The daily Slow Stochastic implies at least a few more days of downside action. The daily MACD has a more bearish message. The bearish lines crossover implies at least a two – week decline.
It’s possible on 04/18/23 the SPX made an important top – meaning a multi- month drop may have begun. There is another scenario that could be happening.
The next blog will illustrate two possible SPX- Elliott wave counts and forecasts for each scenario.
