The 04/20/23 blog noted that the S&P 500 (SPX) had two Fibonacci support levels. One at 4,107.81 and the other at 4,108.06. On 04/21/23 the SPX low was at 4,113.86 only 5.80 points from the prime Fibonacci coordinate.
The SPX – 5 – minute chart courtesy of Trading View updates the action.
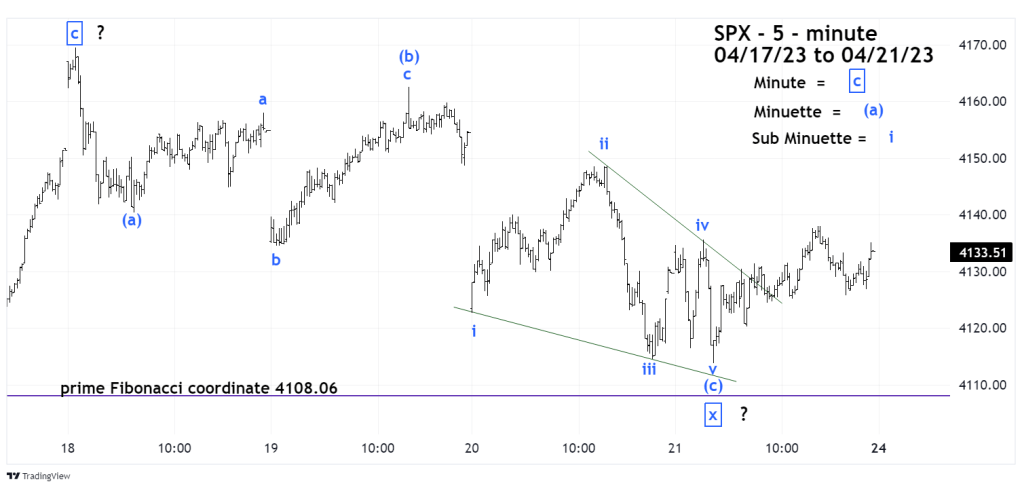
The Elliott wave pattern from 04/18/23 to 04/21/23 is clear, the entire structure is an Elliott wave – Single Zigzag. Minuette wave (a) is a five – wave impulse. Minuette wave (b) is an Expanding Flat. Minuette wave (c) is an Ending Diagonal Triangle.
Unfortunately, how this structure fits into the larger pattern from the 03/13/23 bottom is unclear. There are several Elliott wave alternate counts to explain the action from 03/13/23 to 04/21/23. There’s even a possibility that an important SPX top was made on 04/18/23.
If next week the SPX were to break decisively below the two Fibonacci coordinates at 4,107.81 and 4,108.06 it could be a very bearish signal.
The seasonal bullish period for stocks ends late April/early May. We are now in that time zone. The week of 04/24/23 to 04/28/23 could be the culmination of the rally that began in October 2022. Or the start of a multi month decline.
