Fibonacci time analysis and the next U.S. Consumer Price Index (CPI) report give clues to when an important stock peak could occur.
Sometimes Fibonacci time ratios can project a potential market time zone turns.
The daily S&P 500 (SPX) chart courtesy of Trading View illustrates what could be an important turn in 2023.

The SPX decline in 2022 took 195 – trading days (TD) multiplied the Fibonacci ratio of .618 yields 121 – TD, added to the SPX 10/13/22 bottom targets 04/12/23 as a potential turn date. Note Fibonacci time analysis does not project if a bottom or a top could occur, only a potential turn. If the SPX is declining into 04/12/23 it could mean a bottom is forming.
The SPX – 2 – hour chart examines shorter time frames.

Recent blogs on this site have noted that from 06/17/22 the SPX could be forming an Elliott wave- Inverse Horizontal Triangle. There are usually Fibonacci price/time relationships among the sub waves of a Horizontal Triangle.
Minor waves “A” and “B” are equal in time 1/1.
Minor waves D/B is .627 close to the Fibonacci ratio of .618.
Minor waves A/C is .534 close to the Fibonacci ratio of .50.
Wave “E” is almost always shorter in time relative to wave “D”. In this case the presumed Minor wave “E” is equal to Minor wave “D” on 04/19/23.
It’s more likely that Minor wave “E” could be shorter in time to Minor wave “D”. Minor wave “A” was 162 – 2 – hour bars multiplied by .50 equals 82 bars and targets 04/11/23 almost exactly the prime Fibonacci time target of 04/12/23.
Are there any potential market moving reports due out on 04/11/23 or 04/12/23? Yes, the U.S. Consumer Price Index (CPI) report due on 04/12/23.
The next SPX daily chart shows its reaction to the CPI reports since early 2022.
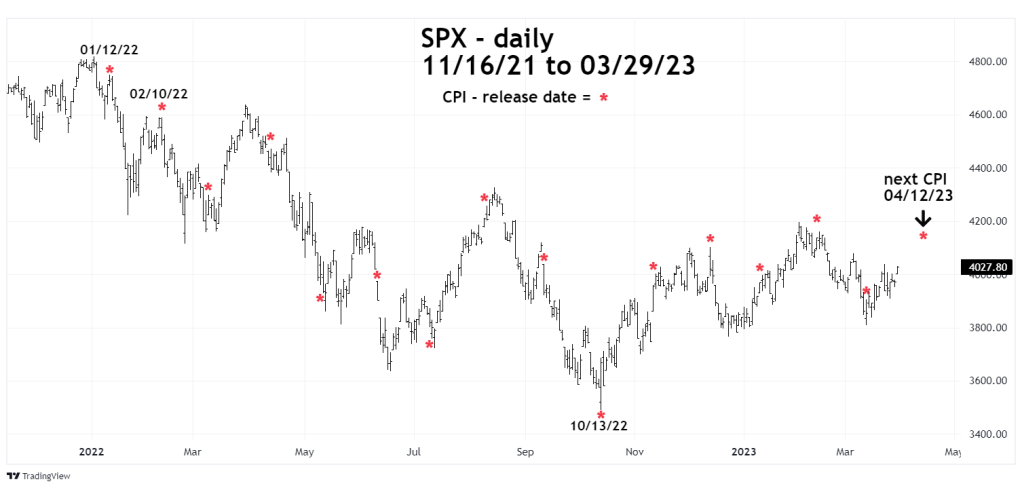
The most significant turns occurred in January, February, and October. The 10/13/22 blog “Dramatic Reversal – 10/13/22” noted that the reaction to the CPI report could be a selling climax. Perhaps the next CPI report due on 04/12/23 could be a buying climax.
Finally, the 03/18/23 blog “Could the U.S. Federal Reserve be Trapped” explained the difficult position of the U.S. Fed. Subsequently a political cartoon was published that sums up the U.S. Fed position perfectly.
The following is from the “San Diego Union Tribune” political cartoonist – Steve Breen.

