This alternate Elliott wave count has the same message as the wave count illustrated in 03/15/23 blog. The message was that the S&P 500 (SPX) could be in a new down phase of a bear market that began in January 2022. If the alternate wave count is correct it could provide Fibonacci evidence of where the next down phase could bottom.
The weekly SPX chart courtesy of Trading View illustrates the alternate wave count.
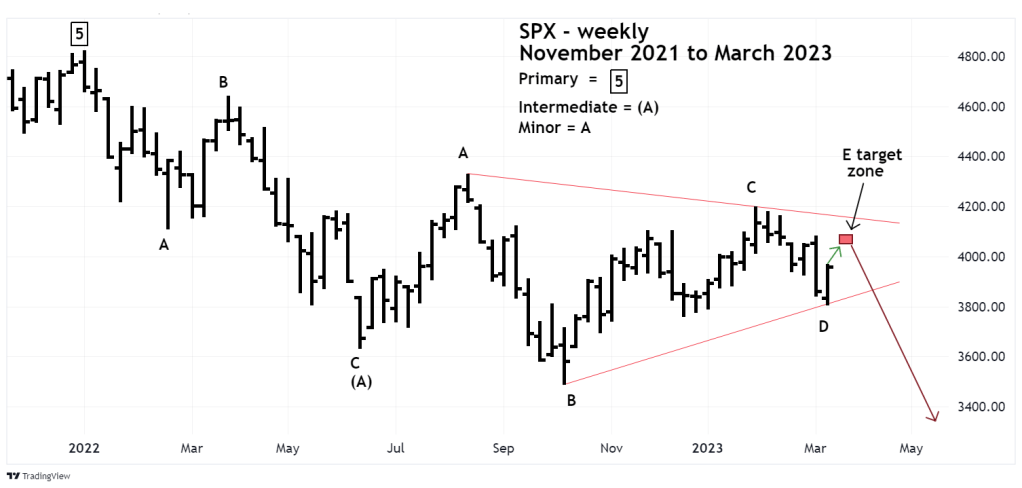
In this count the first bear phase terminates at the SPX 06/17/22 bottom. What follows could be an Elliott wave – Inverse Horizontal Triangle. This type of Horizontal Triangle is referred to as a Running Triangle, in which wave “B” exceeds the point of origin of wave “A”.
The lengths of the presumed sub waves are as follows.
Wave “A” 688.41
Wave “B” 831.70
Wave “C” 703.86
Wave “D” 386.58
Fibonacci relationships are 831.70- B/ 688.41 -A = 1.21 close to the Fibonacci inverse ratio 1.236.
688.41 – A/ 703.86 – C = .978 close to equality 1.0.
386.58 – D/ 833.70 – B = .463 close to .50.
If the presumed wave “E” does end next week it will complete the Horizontal Triangle. Typically after the completion of a Horizontal Triangle there’s a thrust in the direction of the main tend, which in this case is down.
If the triangle does complete next week, the SPX could soon be falling faster than at anytime since the bear market began in early 2022.
