There are always alternate Elliott wave interpretations. This blog examines evidence that the S&P 500 (SPX) may have made a secondary bear market peak on 02/02/23.
The first SPX daily chart courtesy of Trading View illustrate Fibonacci time and price ratios.
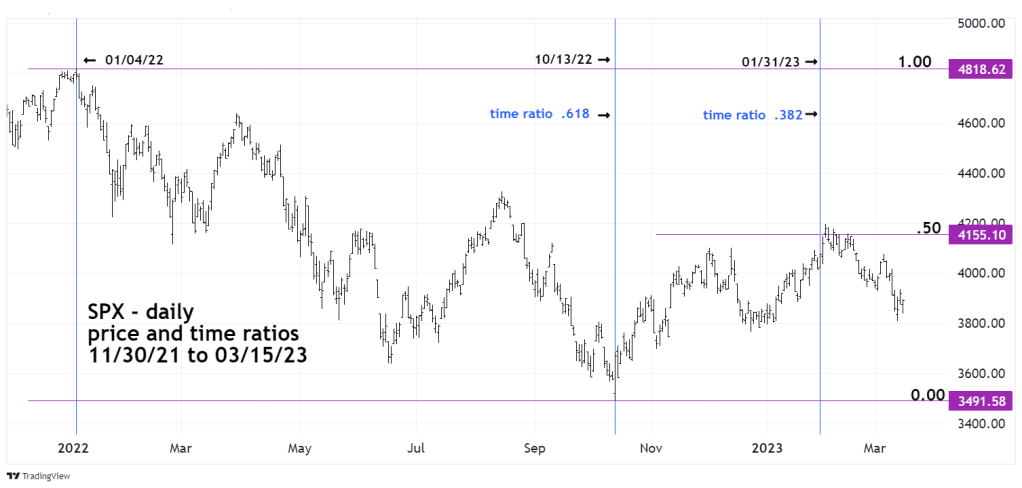
The SPX decline from its all-time high on 01/04/22 to its bottom on 10/13/22 was 195 – trading days. Multiplying 195 by the Fibonacci ratio of .382 equals 74 – trading days. Adding 74 – trading days to 10/13/22 targets 01/31/23 which is only 2 -trading days before the SPX 2023 high made on 02/02/23.
The Fibonacci price relationship is not as precise. There’s leeway around Fibonacci coordinates and there’s no exact limit as to what’s outside a leeway zone. For the Fibonacci .50 coordinate its usually .51 or .52. The retracement of the SPX January to October decline was .53 which could be consider outside the leeway zone.
The next daily SPX chart examines one of possibly two Elliott wave bearish interpretations.
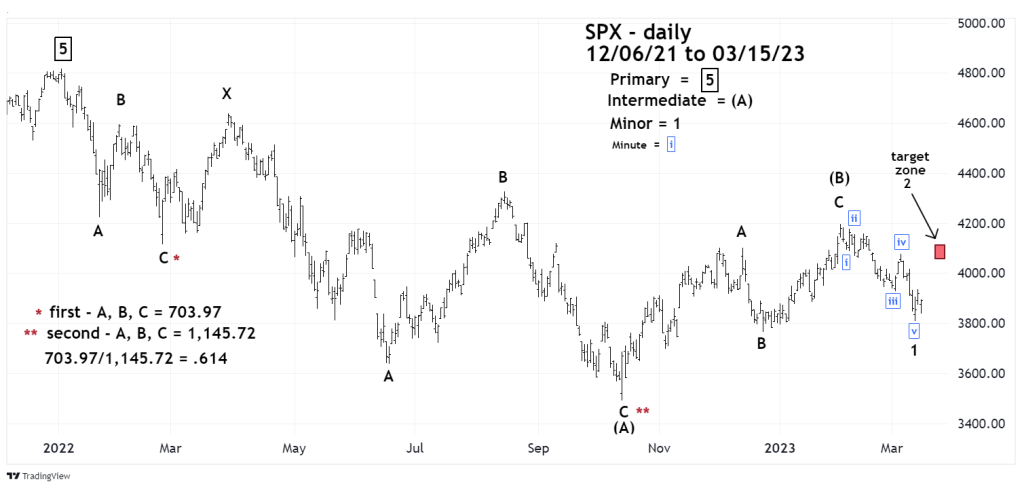
This count illustrates the SPX January to October decline as an Elliott wave – Double Zigzag.
There’s Fibonacci ratio evidence that supports this wave count. The first Zigzag which bottomed on 02/24/22 was 703.97 points. The second Zigzag which terminated on 10/13/22 was 1,145.72 points. A ratio of 703.97/1,145.75 equals .614 almost the Fibonacci golden ratio of .618.
The subsequent October to February rally was an Elliott wave Single Zigzag.
The decline after the 02/02/23 top is harder to analyze because of the frequent subdivisions within the structure. The drop from 02/02/23 to 03/13/23 could be an extended five – wave impulse pattern or a complex corrective pattern. If the SPX 03/13/23 bottom holds, the other bearish Elliott wave interpretation will be shown in the 03/16/23 blog.
If the current SPX rally continues, it could reach a .618 retracement of the prior decline by the FOMC announcement date 03/22/23.
