Elliott wave analysis of the UK 100 (UKX) illustrated in the 02/04/23 blog “Rule, Britannia!” indicated that the long, intermediate and short – term UKX bull trend could soon reach a climax. Fibonacci and trendline analysis provides clues as to where a major UKX peak could occur.
The monthly UKX chart courtesy of Trading View examines the long – term view.
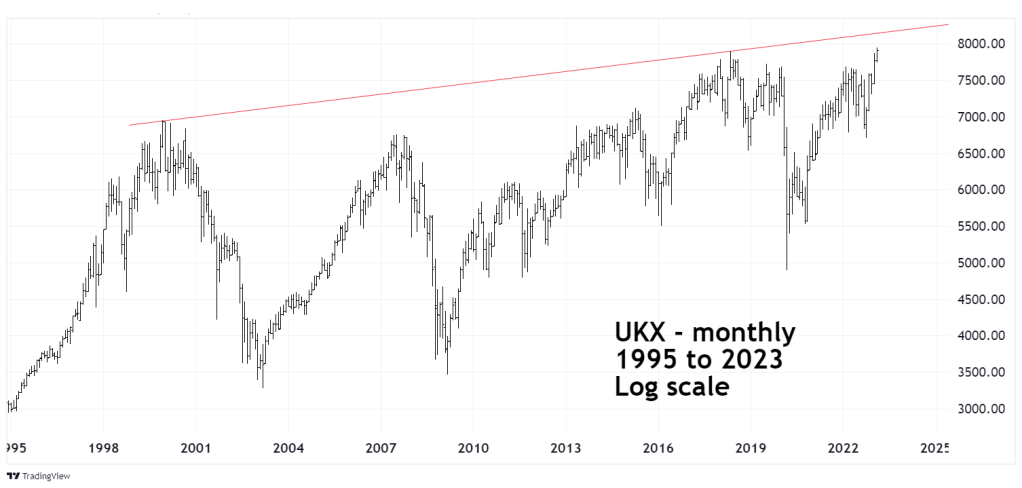
The rising trendline connecting the December 1999 and May 2018 peaks is currently near 8,150. On 02/09/23 the UKX reached a new high of 7,949 and could reach the trendline sometime in March 2023.
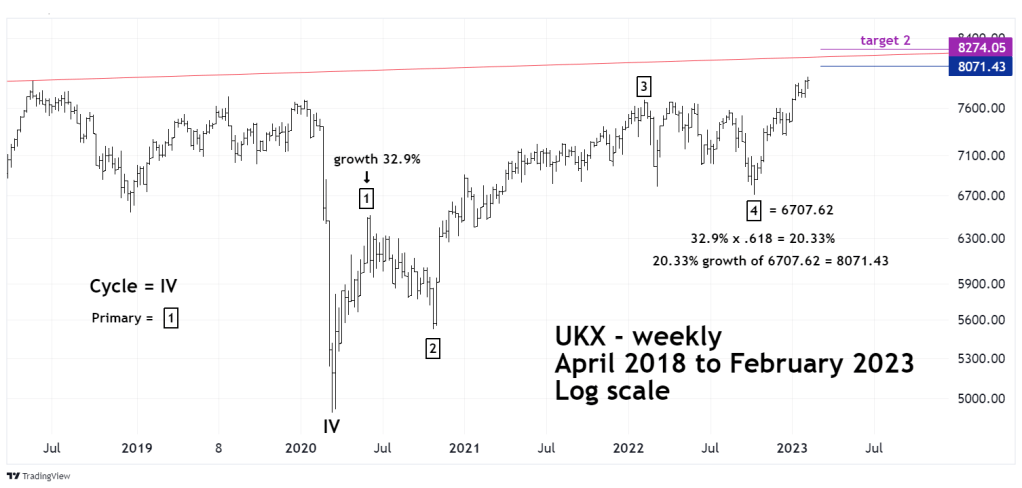
The weekly UKX chart illustrates the intermediate view.
When measuring price projections for assets with large percentage gains its best to compare growth rates instead of price gains.
In Elliott wave analysis the first wave of a motive pattern usually has a Fibonacci relationship with the fifth wave.
Primary wave “1” had a growth rate of 32.9% multiplied by the Fibonacci ratio of .618 calculates to a growth rate of 20.33%. Projecting this growth rate from the Primary wave “4” bottom yields a target of 8,071.43.
Sometimes the growth rate of the first wave a motive pattern projected from the second wave in the pattern can discover the termination point of the fifth wave.
The rally from October 2022 to December 2022 rally is probably Intermediate wave (1) of Primary wave “5”. This wave had a growth rate of 13.3%. Projecting this rate, from the presumed Intermediate wave (2) bottom at 7,302.82 targets 8,274.05 for Intermediate wave (5) top.
The two Fibonacci coordinates bracket the rising trendline, the broad zone for a major top is the area of 8,050 to 8,300.
Based on additional Elliott wave subdivisions of a continuing rally, the target zone could narrow.
