The 12/17/22 blog “The Bear is Back – Part Two” illustrated two S&P 500 (SPX) Fibonacci support levels at 3,806.29 and 3,796.27. On 12/20/22 the SPX bottomed almost exactly at the lower level.
The daily SPX chart courtesy of Trading View shows what happened.
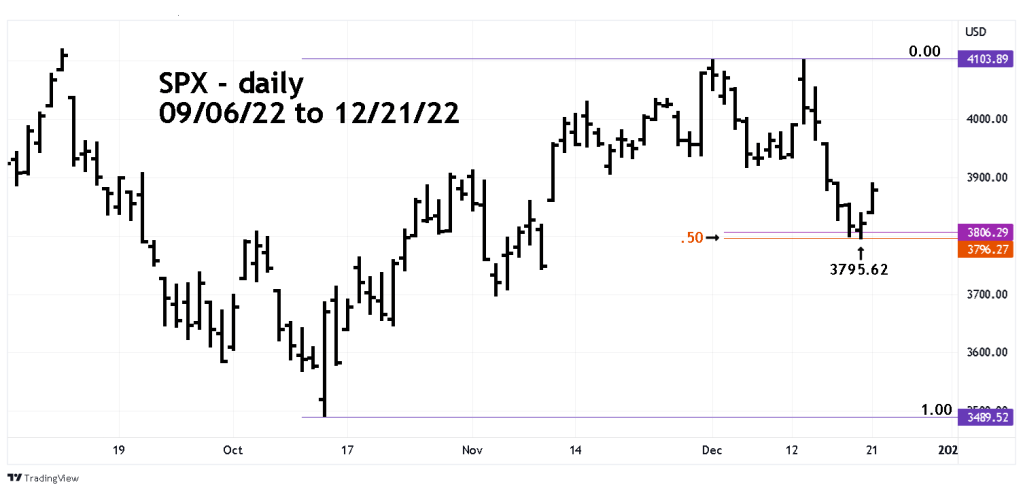
An exact Fibonacci .50 retracement of the SPX October to December rally is at 3,796.27. The bottom early in the trading session on 12/20/22 was 3,795.62 almost a bulls eye hit!
The 15 – minute SPX chart illustrates one of two alternate Elliott waves counts.
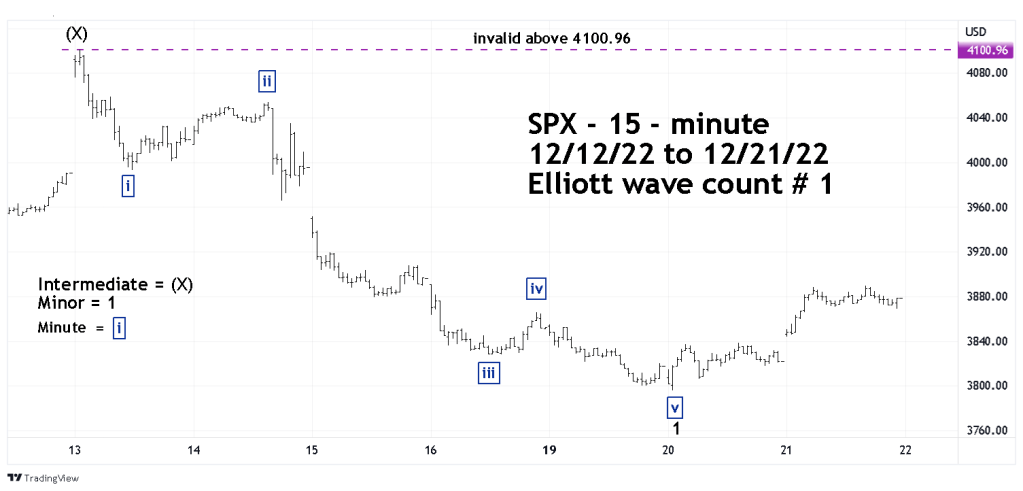
Prior blogs on this website have noted that the SPX decline from the 12/13/22 top looked to be a developing Elliott Impulse wave. It appears a five – wave count completed at the 12/20/22 bottom. If so, the move down from 12/13/22 to 12/20/22 could be partially retraced. Second waves usually retrace about 50% to 61.8% of the first motive patten, in this case the move from 4,100 to 3,795.
After a partial retracement, the SPX could be in a third wave down that ultimately moves below the 12/20/22 bottom.
The hourly SPX chart illustrates the second alternate wave count.
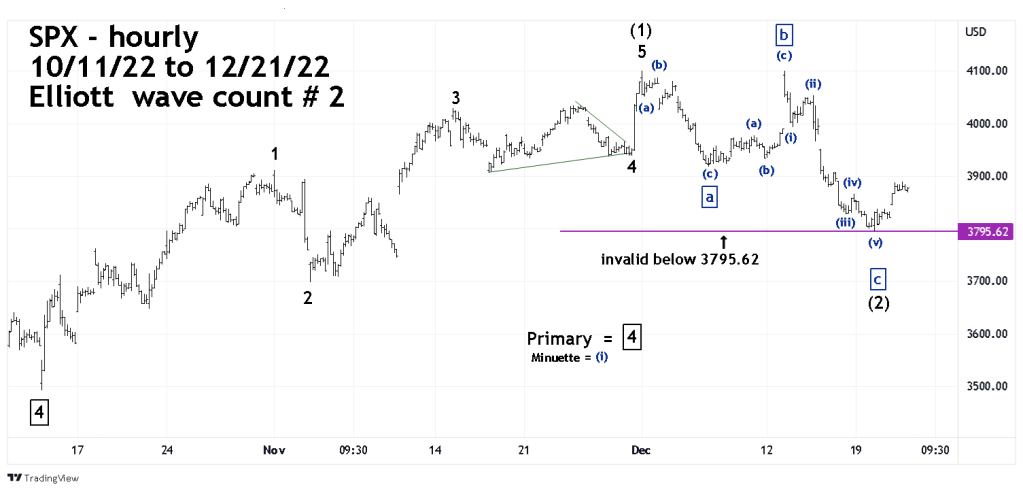
In this wave count an Elliott wave – Expanding Flat formed after the SPX 12/01/22 peak.
Expanding Flats have three segments.
The first segment, “a” subdivides into three waves.
The second segment “b” subdivides into three waves that marginally exceed the wave “a” point of origin.
The third segment wave “c” subdivides into five waves. Note that in both alternate wave counts the move down from the SPX 12/13/12 peak is a five-wave impulse patten.
If the Expanding Flat correction is in effect from the 12/01/22 top it will fake out the bears shorting into the current rally. A rally after the 12/20/22 bottom could at least move marginally above the 12/13/22 peak. It’s also possible the SPX could ultimately move above the high made in January 2022.
Unless the SPX breaks the 12/20/22 bottom, both alternate counts are equally valid. We need to wait for additional evidence to determine which side has the greater strength.
