Breaking Through Resistance – 11/30/22

Today 11/30/22 the S&P 500 (SPX) broke above the 11/25/22 peak and the 200 – day moving average (MA). This  move could trigger fund managers into additional stock purchases.

The daily SPX chart courtesy of Trading View illustrates the action.

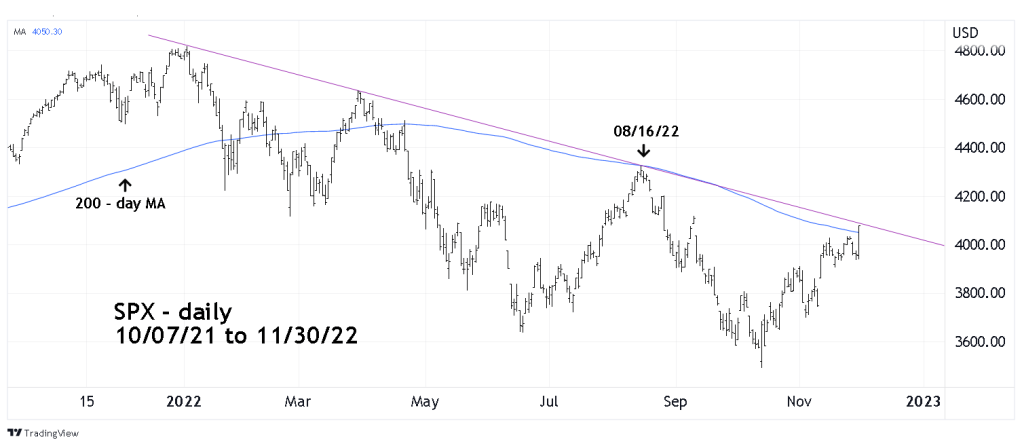
The next resistance is the declining trendline from the January 2022  top.  A move above the trendline could open the door for the SPX to reach at least  the 08/16/22 top.

Today’s big  move up could be the beginning of a spike into a  mid – December 2022  major top.  

Advertisement

Published by Mark Rivest

Independent investment advisor, trader, and writer. Articles have appeared on Technical Analysis of Stocks and Commodities , Traders.com Advantage, Futuresmag.com, and Finance Magnates.

Leave a Reply

Fill in your details below or click an icon to log in:

WordPress.com Logo

You are commenting using your WordPress.com account. Log Out /  Change )

Facebook photo

You are commenting using your Facebook account. Log Out /  Change )

Connecting to %s

%d bloggers like this: