The SPX 500 (SPX) rally from 10/13/22 to 11/01/22 appears to have completed an extended Elliott wave impulse pattern.
The 30 – minute SPX chart courtesy of Trading View illustrates the action.
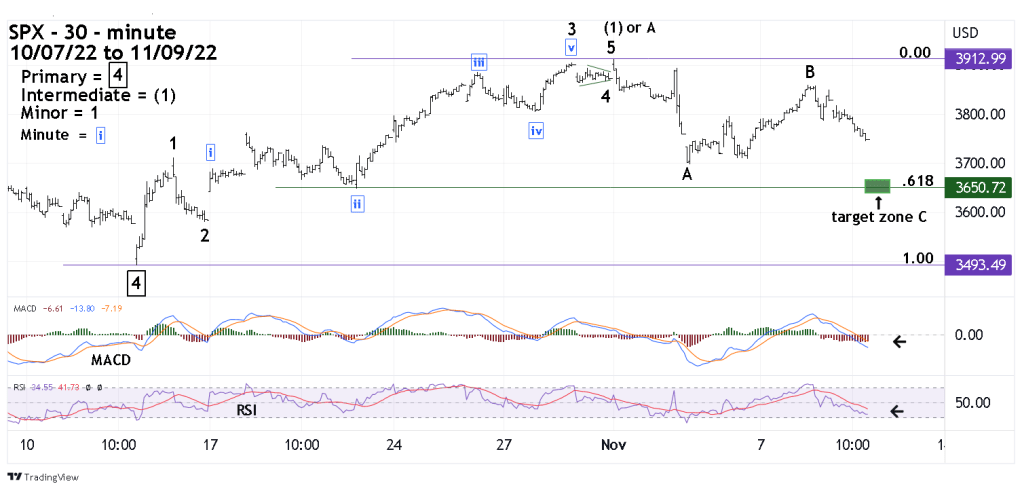
The decline from the 11/01/22 top looks like a developing Zigzag correction. If so, it could complete near the 3,650 area which is also the termination point of the presumed Minute wave ‘ii’ of Minor wave “3”.
The 30- minute RSI has not reached the oversold zone and the MACD – Histogram has not begun to diverge. Both indicators imply more downside action.
The Zigzag correction could terminate on 11/10/22 or 11/11/22.
