Today 08/29/22 the S&P 500 (SPX) broke below the .382 Fibonacci support level; also, bullish momentum divergence were eliminated. This opens the door for lower prices.
The daily SPX chart courtesy of Trading View illustrates the next near – term support levels.
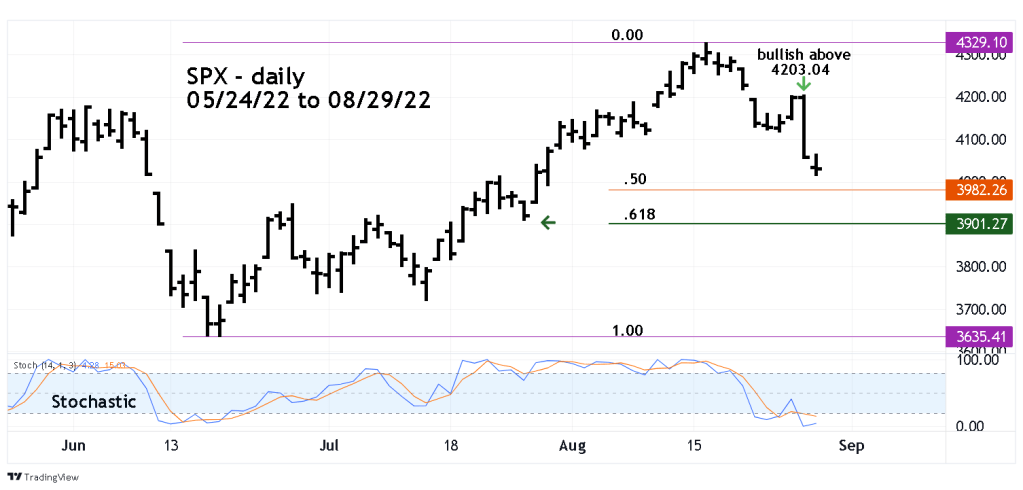
The Fibonacci .50 level is usually a weak support/resistance level. The Fibonacci .618 level is usually a stronger price magnet. In this case the .618 retracement of the SPX 06/17/22 to 08/16/22 rally is at 3901.00 which is close to chart support at 3910.74. This is the most likely near-term support level.
A move above SPX 4203.04 could open the door for a move above the SPX 08/16/22 high.
The calendar could soon be a very important factor. The seasonal bearish time zone for stocks begins in early September. After the US Labor day holiday on 09/05/22 stocks could begin another sharp decline.
Watch the calendar.
