The 08/11/22 blog “Entering the Danger Zone” illustrated a price and time area where/when a significant S&P 500 (SPX) peak could occur. This could be a danger zone for stock bulls. The time zone is from 08/17/22 to 09/01/22. The price range from SPX 4235 to 4320. On 08/16/22 one day before the time zone and five – points above the price range the SPX peaked.
Could an important top for US stocks been made on 08/16/22? The daily RSI momentum indicator may have the answer.
The daily SPX chart courtesy of Trading View updates the action
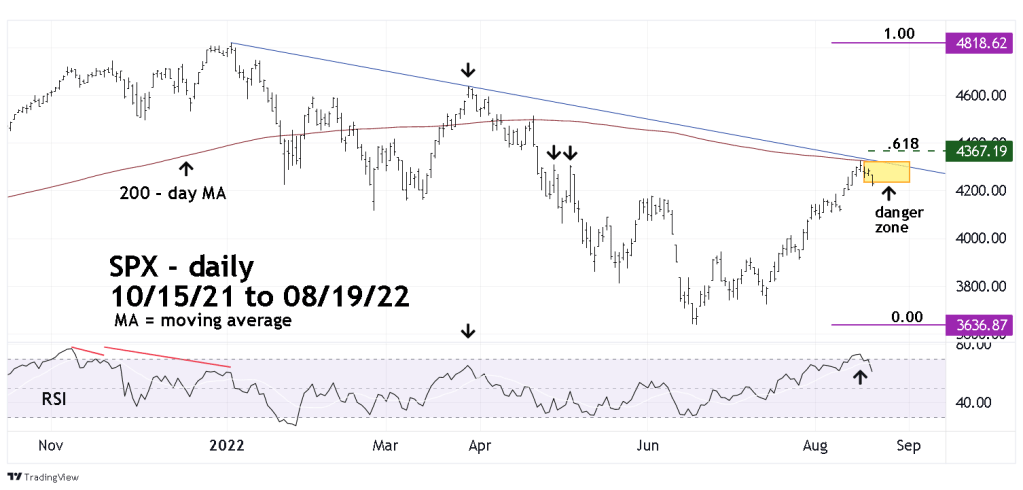
The tine zone was determined by the examination of significant August tops for US stocks during the last 93-years. The price range was based upon the double top made 04/28/22 and 05/04/22. Another factor was the declining trendline connection the January and March 2022 peaks.
On 08/16/22 the SPX came close to the declining trendline and had a direct hit of the SPX 200-day moving average (MA). Frequently in bear moves the 200-day MA will act as resistance. In this case right on cue, the SPX declined. The start of a large drop? Perhaps, however the daily RSI hints at more upside action.
With stock indices the RSI usually has at least one bearish divergence signaling a potential price top. Based on extensive studies I’ve done with the RSI on several time scales, the probability is nearly 90%. When RSI is not diverging with price it implies higher prices. This phenomenon applies only to stock indices and is probably the best tool to discovering stock market peaks.
Note the RSI bearish divergences in late 2021 and early 2022. On 08/16/22 both the SPX and RSI peaked together. Also note the SPX 03/29/22 top was a rare example of a price top occurring without an RSI bearish divergence. Later another stock index did have a bearish RSI divergence.
The daily Dow Jones Industrial Average (DJI) chart illustrates the 2022 decline and subsequent rebound.
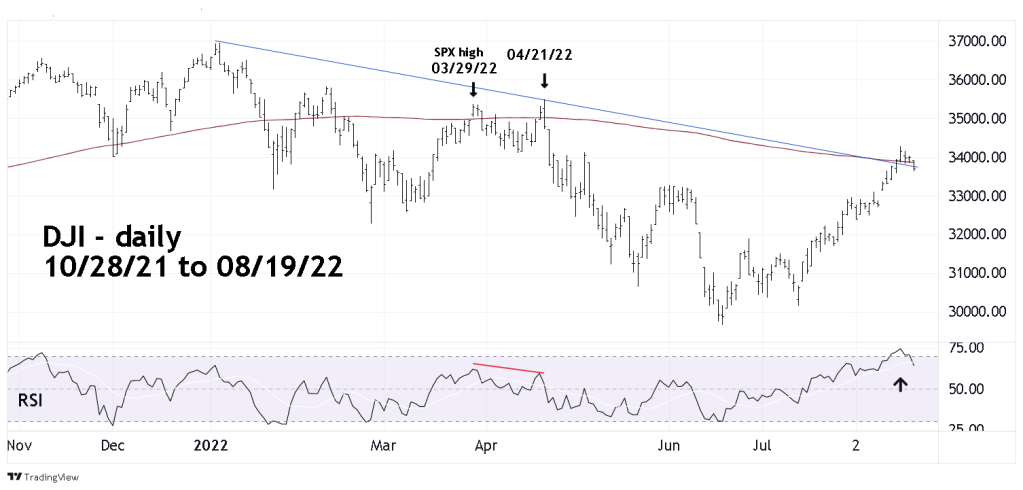
Note that on 03/29/22 the DJI top did not have an RSI bearish divergence. Then three – weeks later the DJI moved marginally above its 03/29/22 peak with an RSI bearish divergence. The 04/21/22 DJI post 03/29/22 high was also unconfirmed by the SPX and Nasdaq Composite (IXIC).
From 08/22/22 to 09/01/22 watch all three main US stock indices, SPX, DJI, and IXIC. If any one of the main US stock indices moves above their respective 08/16/22 peaks with a bearish RSI divergence it could be signaling an important top.

Great blog. I especially liked the insight about the high probability of seeing bearish divergence on RSI at major tops. Thanks for sharing your knowledge and sharing the results of your studies!
LikeLike
Thanks for the compliment. I recomend everyone to examine the relationship of stock indices rally highs to maximum RSI readings – on any time scale. You will be amazed with the degree of effectiveness.
LikeLike