Today 08/11/22 the S&P 500 (SPX) entered what I call “The Danger Zone” this is a price and time area where the SPX could make a significant top. An examination of SPX, monthly, weekly and daily momentum indicators illustrate clues that a top could be forming.
The monthly SPX chart courtesy of Trading Views shows the long – term view.
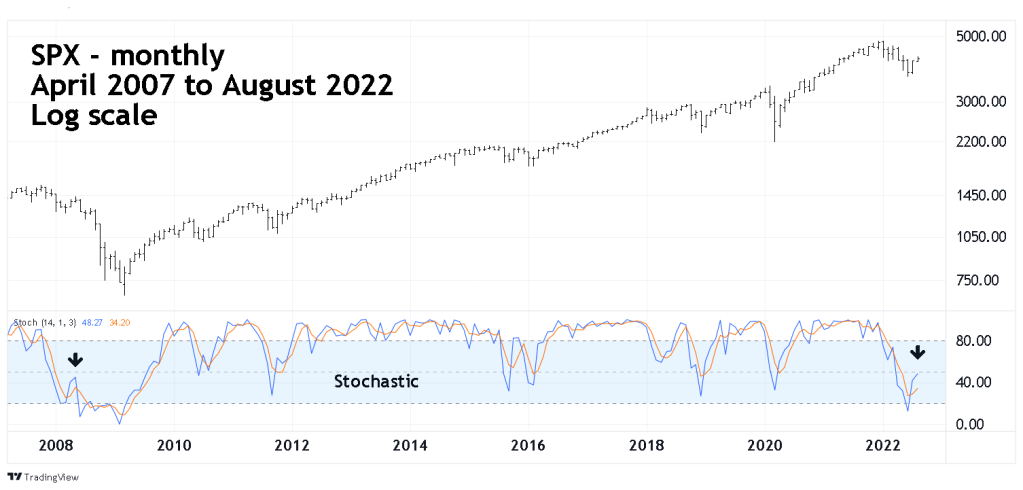
This is an update of the chart illustrated in the 07/30/22 blog “Market Fuel Gauge” the monthly Stochastic is now at the same general area as the SPX March to May 2008 rally.
The weekly SPX chart shows the Intermediate – term view.

The upper – blue line is in the overbought zone. The lower – orange line has just reached the edge of overbought – 80%. Both lines could remain in the overbought zone for several weeks.
The daily SPX chart illustrates the short-term view.

The time zone for a top is from 08/17/22 to 09/01/22 and based upon prior significant August peaks. The price zone of SPX 4,235 to 4,320 is based on the declining trendline connecting the January and March tops, and the price area around the double peak made on 04/28/22 and 05/04/22.
The daily RSI is now at 67% which is the highest level reached in 2022. Typically, significant tops come when the RSI has reached the overbought zone and has at least one bearish divergence.
In the very short-term based on momentum and intraday price structure the SPX appears it could continue to rally – at least into 08/17/22.
Soon US stocks could be making a very important top.
